I want to track the page time metric in GA4. Please help me out with the steps
Nov. 1, 2023
1
-

-
 Mod
ModBefore you begin, make sure you have Google Tag Manager and GA4 installed on your site. You should also familiarize yourself with the basics of tags and triggers in Google Tag Manager. You can begin creating a timer trigger and GA4 event tag. The end result will be a "timer_1min" event in your GA4 event reporting, but you can adjust the time duration to suit your needs.
Here are the steps involved in the process:
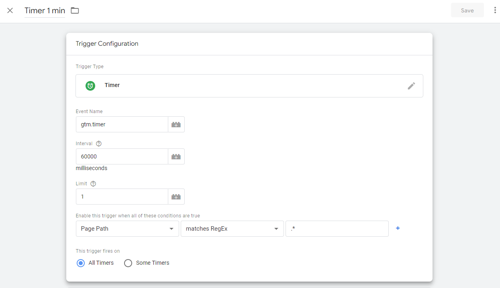
- To create your timer trigger in Google Tag Manager, go to "Triggers" and choose "Timer" as your trigger type. Set your interval to the desired amount of time in milliseconds and set your limit to 1. Set your trigger to fire on all pages by using a Regular Expression of ".*".
Note: If you want your Timer to fire at a different time, adjust your interval accordingly. Here’s a reference for you.
-
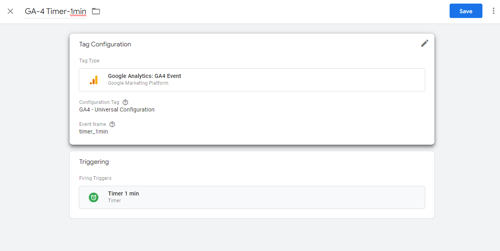
Next, create a GA4 event tag by selecting "Tags" and choosing "GA4 Event" as your tag type. Select your GA4 property and enter the event name (e.g. "timer_1min") in lowercase and without spaces. Save your GA4 event tag and set it to fire by pairing it with the timer trigger you created in the above step.
-
Test your trigger and tag using preview mode in Google Tag Manager and DebugView in GA4. Once you're confident everything is working properly, publish your GTM container to make your changes live.
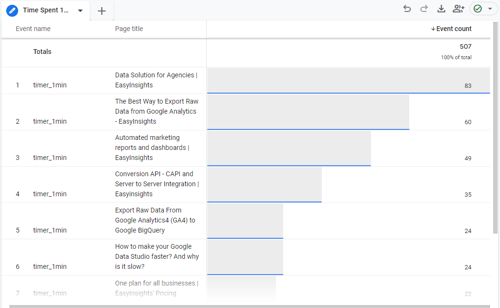
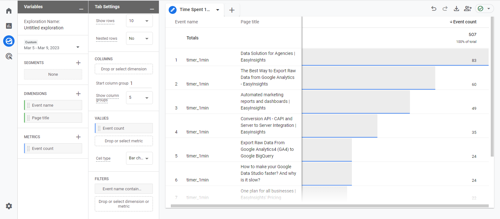
Make a Custom Exploration in GA4 For Reporting
To see page level insights, you'll need to create a custom exploration in GA4. This will allow you to select the appropriate dimensions and metrics to build a report. The steps for choosing the appropriate dimensions and metrics to produce a report precisely like the one above are listed below:
- Go to the “Explore” tab in GA4 and open a blank exploration tab.
-
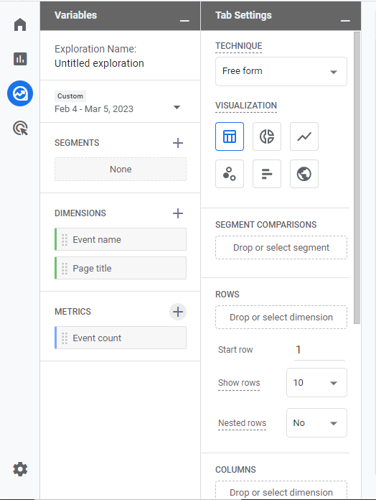
Under the “Variables” section, import the “Event name”, “Page title” dimensions and “Event count” metric.
-
Under the “Tab Settings” section, choose “Free form” as technique and “Table” as visualization. Now drag & drop the dimensions (Event Name & Page title) in rows and metrics (Event count) in values. Also, apply a filter on dimension “Event name” containing “timer_1min”. Vola! The report you sought is now visible.
Hope this helps. Feel free to comment if you have any more queries
- To create your timer trigger in Google Tag Manager, go to "Triggers" and choose "Timer" as your trigger type. Set your interval to the desired amount of time in milliseconds and set your limit to 1. Set your trigger to fire on all pages by using a Regular Expression of ".*".