In UA, a Site Speed report was generated, but it's not so in GA4. Is there a way to implement the page load time on GA4?
Any help would be most appreciated!

In UA, a Site Speed report was generated, but it's not so in GA4. Is there a way to implement the page load time on GA4?
Any help would be most appreciated!

Hi @carora,
As of now, GA4 lacks a 'Page Timings' report and does not include page load time metrics. It remains uncertain whether Google will introduce loading time metrics to GA4. Therefore, let's explore how we can leverage Google Tag Manager to generate reports on our page loading times in Google Analytics.
To begin, it is essential to have Google Tag Manager (GTM) implemented and ensure you have set up a GA4 configuration tag within your GTM container.
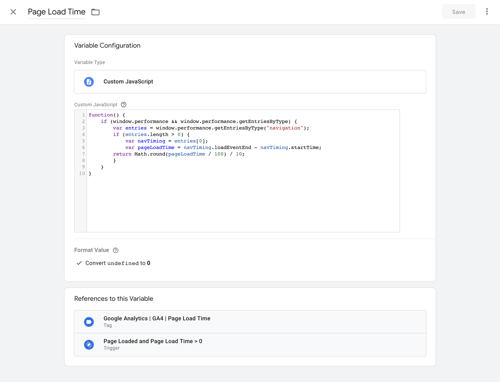
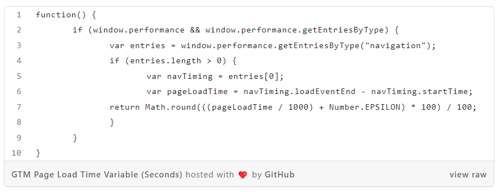
Step 1 - Create A Custom Javascript Variable
[
(/forum/a/sDXsCTlvTGojEc4ROdRfkscQrjHdMHW0Zidcqg48ZMqpLQVyGCD656jMsmDXjJt4/6/?shva=1)
This is how the variable appears in Google Tag Manager (GTM):
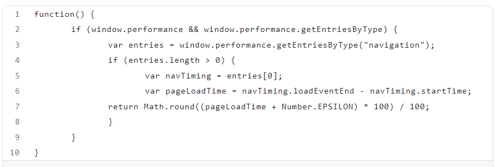
This custom JavaScript variable utilizes the Performance Navigation Timing API to compute the duration in milliseconds between the loadEventEnd and startTime, providing us with the page load time. Subsequently, we convert the result from milliseconds to seconds.
If you prefer more detailed reporting of page loading time in Google Analytics, you can modify the script to report the duration in milliseconds instead of seconds. Below is the JavaScript version that will provide you with milliseconds:
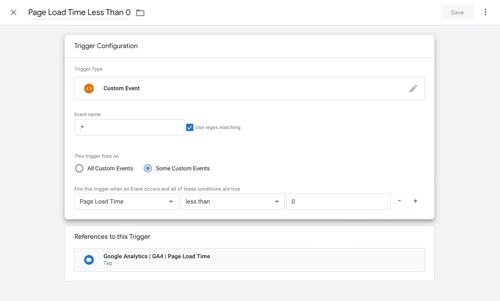
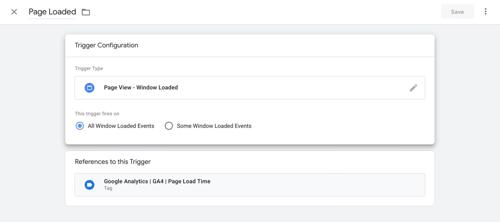
Step 2 - Create a Trigger
The subsequent task involves setting up a trigger that will activate our GA4 event tag. To achieve this, we will create a trigger using the 'Window Loaded' trigger type. This trigger will fire the tag once a page has fully loaded in the user's browser. Here is the trigger setup:
[
(/forum/a/1tToDsvqEGm9rVEFcyjlwuSdnRBdQcNV7whAidwE0lK5dnisj9ng8trkvSYo44dK/9/?shva=1)
Furthermore, we'll establish a second trigger to prevent the GA4 event tag from firing in case our custom JavaScript variable returns a value less than zero.
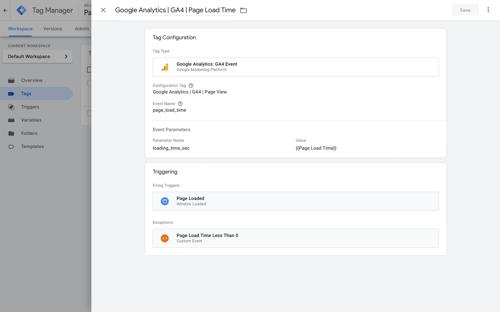
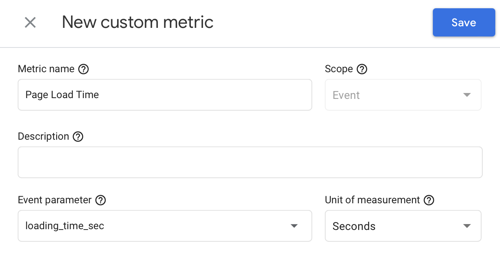
Step 3 - Creating a Tag
With the custom JavaScript variable capturing the page loading time and our triggers set up, we can proceed to craft our GA4 event tag. This tag will facilitate the transmission of the loading time data to Google Analytics 4.
I've chosen to label the event as "page_load_time," but you have the flexibility to designate any name you prefer for your event. Additionally, I'm transmitting the page load time to Google Analytics by employing the "loading_time_sec" parameter, measured in seconds.
Step 4 - Setting Parameters
Having established the custom "page_load_time" event, the next step is registering our "loading_time_sec" parameter in GA4. For this, you must have edit or admin permission in Google Analytics. Proceed by navigating to the 'Configure' section and then selecting 'Custom Definitions.' Here, you will create a new custom metric to effectively utilize the parameter value in generating detailed reports
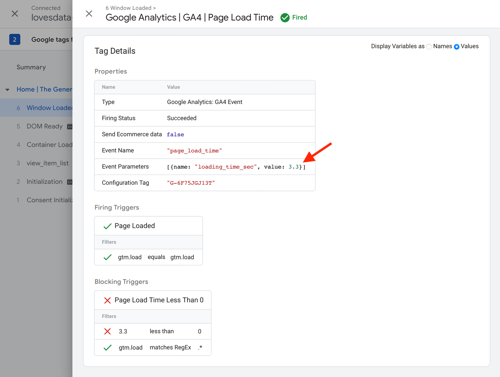
Step 5: Testing the Tag and Publishing it
For the concluding step, it is essential to thoroughly test the tag, triggers, and variable within your GTM container. This process allows you to verify the accurate transmission of the page loading time value to GA4. Once you are confident in the setup, proceed to publish your container.
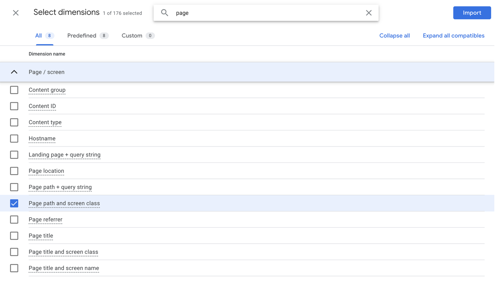
How to Generate Page Load Time Reports in GA4
To begin, access the 'Explore' section and proceed to generate a new blank report. Now add a dimension - Page path & class. You can also use landing page/page title/page location
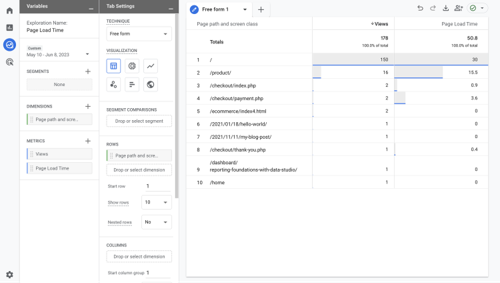
Next, I will include the 'Views' metric and the custom 'Page Loading Time' metric to the report.
By adding these metrics into the report, we can now observe the loading time for individual pages on our website. Nevertheless, the current presentation shows the total loading time for each page. While we anticipate that Google may introduce the ability to display averages for custom metrics in the future, currently, we have two options to achieve this: exporting our data or employing Looker Studio.
Using Looker Studio to Report on Page Load Time
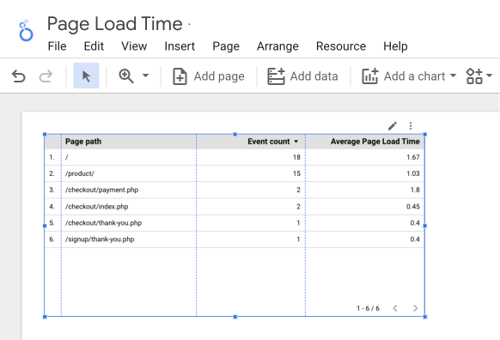
To begin, you must create a report and establish a connection between your GA4 property and Looker Studio.You can do so quickly using EasyInsights (Link). Afterward, generate a table and include your preferred page-based dimension. In my example, I have used 'Page Path,' but you can opt for any other suitable option. For the metrics, I recommend adding 'Event Count' and 'Average Page Loading Time.'
As we previously established our custom 'Page Loading Time' metric in Google Analytics, Looker Studio automatically offers the following fields for utilization in our reports:
A. Page Loading Time: Presents the overall combined loading time for your pages, similar to what we observed directly in Google Analytics.
B. Average Page Loading Time: Calculates the average loading time based on the custom metric registered in Google Analytics.
C. Count Page Loading Time: Provides the total count of instances when the loading_time_sec parameter was collected.
Lastly, we should include a filter in our chart to address potential scenarios where a page view was captured without our page load time tag firing. This could happen due to trigger adjustments to prevent the event from firing on every page, errors during data collection, or when the page loading time was calculated as zero seconds (or even less).
By following these steps, we will obtain a table that presents the average loading times for the pages on our website. Looker Studio will automatically exhibit the loading time metric in the format of hours, minutes, and seconds. However, if you prefer a numeric representation, you can achieve this by clicking on the edit icon (the small pencil icon) next to the metric. Then, modify the 'Type' from 'Duration' to 'Number.' This adjustment will make the data easier to read and comprehend.
That’s that! You can now view the page load time in GA4. hope this helps!