@yasir007462 - Please share the screenshot of your Conversion Goal setup on Microsoft ads and web Pixel API setup on Shopify.
agkhy
- Moderator
- Mod
- Joined April 10, 2023
-
Is Facebook CAPI necessary for tracking users after third-party cookies are phased out? Facebook Conversions API ( CAPI ) July 2, 2024, 10:15 a.m.
The logic makes sense, but the confusion seems to come from the terminology. Facebook often compares third-party cookies with first-party data. First-party data includes info that users voluntarily provide, like emails, phone numbers, and persistent IDs used by apps or stores.
When the Facebook pixel tracks an event using JavaScript, it can access the _fbp cookie, which might be tied to a paid ad click or something else. For example, on a purchase thank-you page, there might not be any personally identifiable info available.
On the other hand, server-side data includes more detailed info, like the original click ID, name, and email if the user has signed up before. This makes server-side integration better for attributing conversions compared to just pixel tracking.
The problem with first-party cookies is that, ideally, cross-domain third-party cookies would be used, giving the tracking pixel access to facebook.com cookies on any site. However third-party cookies have been blocked in Safari for years and will be phased out in Chrome by 2024.
So, the industry has moved to first-party cookies combined with server-side integration. First-party cookies might be enough for immediate purchases, but they're limited for broader tracking. The Conversions API, with access to original click IDs, cookies, and personal data, gives much better data accuracy in Ads Manager than pixel tracking alone.
-
Should I remove Facebook Pixel tag if I’ve set up the Facebook Conversion API via GTM Facebook Conversions API ( CAPI ) June 26, 2024, 10:21 a.m.
I can see where you're coming from, but Facebook advises against relying solely on server-side tracking because you might miss out on crucial browser-native events like PageView or ViewContent. They suggest using both the Pixel and the Conversions API together. This way, Facebook can avoid counting the same event twice and make conversion tracking more accurate and effective.
-
Why is there a difference between TikTok Ads and Shopify dashboard analytics? Shopify June 25, 2024, 10:23 a.m.
To answer your question, look into how each platform calculates analytics. Different platforms have different methods for tracking analytics. Each platform has different criteria for tracking visitors and sessions, such as how long a returning visitor stays before it is counted as a new session. Attribution can also make a difference. For example, if someone visits your store from TikTok, leaves, and then returns via another link, you might attribute the conversion to TikTok (the initial source) or the second link (the actual converter). Opinions vary, and advertising platforms often have an incentive to credit themselves for conversions.
Shopify has documentation explaining why its analytics might differ from Google Analytics, which could be a good starting point. Additionally, check TikTok's attribution methods. This will help you understand the differences and choose the analytics approach that best suits your model for campaign decisions.
-
Purchase events not firing in GA4, Google Ads, and Facebook Ads for my Shopify Website Shopify June 25, 2024, 10:17 a.m.
Hey there,
I've encountered this issue before. It usually happens when events don't pass through the data layer properly. Relying only on browser-side tracking might miss customer events, especially with ad blockers and the iOS 14 update blocking cookies. Third-party cookies also have limitations. For a more reliable solution, consider setting up server-side tracking via Google Tag Manager on a first-party domain. -
Facebook Ads show completed purchases, but Shopify shows no orders Shopify June 25, 2024, 10:11 a.m.
The Facebook pixel here is configured correctly which is responsible for tracking the 'Purchase' event on your website. It is firing incorrectly on actions that are not actual purchases. Here's how you can address this issue:
Step 1. Review Facebook pixel installation
- Navigate to your Shopify Admin panel.
- Now click on 'Online Store' and then click on 'Preferences'.
- Scroll down to the Facebook Pixel section and make sure that your Pixel ID is correct.Step 2 Check purchase event configuration
- Go to Facebook Ads Manager.
- Open the 'Events Manager' tab.
- Select your Pixel and review the setup for the 'Purchase' event.Step 3 Test the Pixel with Facebook Pixel Helper
- Install the Facebook Pixel Helper extension for Google Chrome.
- Go to your store's checkout page and make a test purchase.
- The Pixel Helper should be able to show a 'Purchase' event triggered upon order completion. If it triggers at any other time, there is your problem.Step 4 Adjust your pixel
- If the Pixel fires incorrectly, adjust the event in 'Events Manager'.
- Use the 'Event Setup Tool' to specify that the 'Purchase' event should fire on the 'Thank You' or order confirmation page. -
I have identified the issue. This issue started when new GDPR guidelines for cookies and customer data collection. To resolve this, navigate to customer privacy settings in preferences. If you've collected data after consent, make sure that the cookies banner is enabled.
For more information check Shopify Help Center | Configuring customer privacy settings -
Why Invitations are not being sent to new users added to GTM account? Google Tag Manager Dec. 21, 2023, 8:47 a.m.
If the users are unable to locate the invitations in their email inbox, they can directly access GTM by logging in as the user to whom the invitation was sent. On the top of the account list page, they should see a pending invitation for the account.
-
The gtm.formInteract event is not an officially supported event by Google Tag Manager (GTM). It appears to have been a test event briefly available in some GTM containers but has since been removed.
While third-party developers might create custom events like gtm.formInteract, it's crucial to understand that these events are not officially endorsed by Google. Consequently, they may lack reliability and consistency across different containers.
If your GTM implementation relies on a custom event like gtm.formInteract, it is advisable to transition to an officially supported event by Google, such as the built-in Form Submit event or the Click event. Doing so ensures the reliability of your tags and their continued functionality in the future.
-
Is consent mode mandatory for tag to understand that user has agreed to use cookies? Google Tag Manager Dec. 21, 2023, 6:53 a.m.
Your understanding is on-point. As per Google's documentation, the "gcs" parameter serves to indicate the user's granted consent type. When consent mode is either not configured or not mandatory, the default setting for the parameter should be "gcs=100." This signifies that neither ad consent nor analytics consent has been granted.
To summarize:
- gcs=100: Ads consent not given and analytics consent not given (default when consent mode is not configured or not mandatory)
- gcs=110: Ads consent given and analytics consent not given
- gcs=101: Ads consent not given and analytics consent given
- gcs=111: Ads consent given and analytics consent given
By incorporating this parameter in the request, you ensure that the information is utilized in accordance with the user's specified consent type.
-
Tracking for "Begin_Checkout" & "Add_Payment" events inaccurate-displayed as "form start" Google Tag Manager Dec. 21, 2023, 6:38 a.m.
We have examined the julibees.com/ domain and noticed that the "Begin_Checkout" event is not consistently triggered every time we click on checkout and land on the checkout page. It appears that the event fires for new users during checkout, but when adding a new product to the cart and proceeding to checkout again, the event does not fire.
Could you please review the implementation to ensure that the "Begin_Checkout" event fires each time a user clicks on checkout and lands on the checkout page?
Additionally, we are unable to verify if the "Add_Payment" event is firing when clicking "pay now" as we lack the testing credentials.
-
Is there a way to find Bounce rate in Google Analytics 4 (GA4)? was there in UA Reporting Dec. 21, 2023, 6:27 a.m.
At present, Google Analytics 4 does not automatically display the bounce rate as a default metric in its reports. It needs to be added manually. Here's a step-by-step guide on how to do it:
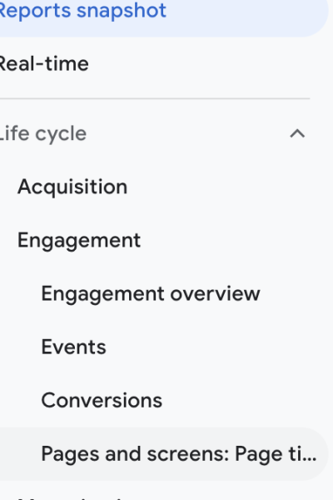
Step 1: Access your GA4 property by logging in, and on the left-hand side, choose "Reports."
Step 2: While on the "Reports" tab, choose "Pages & Screens."
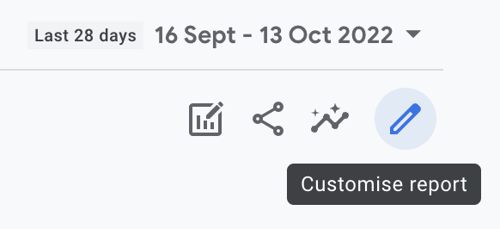
Step 3: If you have the appropriate permissions, you'll notice a pencil icon located at the top right-hand side. Click on it to edit your report.
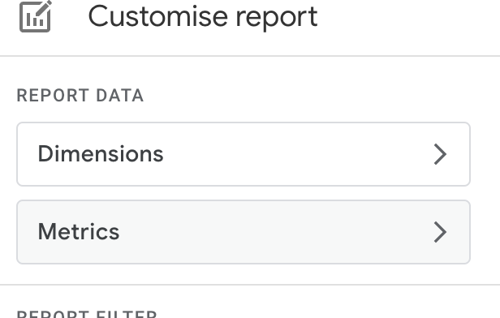
Step 4: Select "Metrics" and then choose "Add metric."
Step 5: Locate "Bounce Rate" in the drop-down list and choose it. Arrange the order in which you want your columns to appear, then click "Apply."
Step 6: Bounce Rate should now be incorporated into your reports. If you want this to be a lasting modification, be sure to click the "Save" button.
And there you have it! Keep in mind that bounce rate remains accessible in GA4; you just need to know where to find it!
-
Do modifications made in Google Tag Manager affect insights or data in Google Ads? Google Tag Manager Dec. 21, 2023, 5:21 a.m.
Yes, modifications in GTM can have an impact on the insights derived in Google Ads. Altering the GTM configuration can influence how data is gathered and transmitted to Google Ads, potentially affecting the algorithm's capacity to optimize and make informed decisions based on historical data.
In the specific situation you outlined, changing the pageview trigger in GTM from landing page A (/thank-you) to landing page B (/thank-you12) has the potential to reset the learnings in Google Ads. The system may treat the new landing page B as a distinct entity, and the historical data linked to the previous landing page A might not be retained. Consequently, this could disrupt the algorithm's ability to comprehensively understand user behavior and conversion patterns.
The observed significant decrease in recorded conversions, following the switch from thank-you page A to B for your conversions, indicates a negative impact on the performance of your Google Ads account due to the change.
-
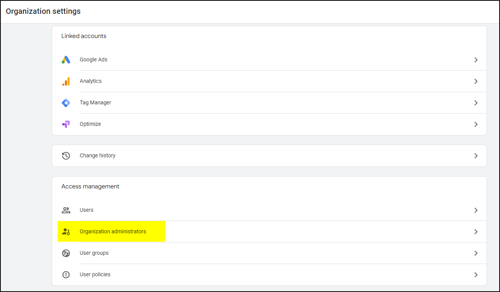
Have you updated the permissions on Google Marketing Platform?
marketingplatform.google.com/ -
Steps to integrate CRM with Google Analytics -
Step #1 Choose a key
The main requirement for integrating CRM and Google Analytics together is the availability of a common key that can map the two data sets together.
Here are a few things that you need to consider when picking out a key to merge data from CRM and Google Analytics -
1. The key should be unique — now and always. If there is a chance your key might not stay unique for users in the future, you run the risk of overwriting and corrupting your data.
2. The key cannot be a personally identifiable information (PII) like a phone number, email address, or user login ID because it goes against Google’s Terms and Services and it can also put your customer data in jeopardy.
Theoretically speaking, you can come up with your own unique keys for both of the platforms and then integrate them together. But it will only require more effort and time at your end. An easier way is to use a key that already exists in the two platforms.Google Analytics has a preset parameter called Client ID (CID) which seems like an obvious choice. But here’s the issue with CID — Google Analytics generates a new CID for every new browser or device. That means if the same user uses two different browsers to access your website, they will be assigned two different CIDs and they will seem like two different users which can directly affect your data integrity.
A way out is to use Google Analytics’s UserID override feature to create your own user ID (UID) and then connect it to your CRM.
In case your CRM doesn’t have a unique UserID, you can generate one by hashing the customer email address or the phone number and then passing it through Google Analytics. Note that, you can’t directly use an email address or phone number as ID since that will be a privacy violation.
Step #2 Prepare Google Analytics for integration
Before you send data to Google Analytics, you need to give it a bit heads up. After all, if Google Analytics doesn’t know what to do with all the incoming data, it will just drop it and you won’t get any results.
1- Install Google Tag Manager on your website (or any other tag manager, but GTM works the best since it’s already closely integrated with Google Analytics and you don’t have to go through any extra work). We need the Tag Manager in order to set up the variables which are required to capture and send UserID to Google Analytics.
2- Enable and capture User-ID reporting in your Google Analytics
To enable User-ID in Google Analytics, go to Admin → Select the Property for which you want to integrate CRM data → Tracking Info → User-ID
Activate User-ID and set up a new one to create a User-ID view.
Once you enable User-ID in Google Analytics, you will start seeing a new view of analytics reporting.
There are a few ways to capture UserID in Google Analytics -
With the help of DataLayer: Push your UserID into the DataLayer of Google Analytics and then create a DataLayer variable in the Google Tag Manager. At this stage, you should just make sure the name of the UserID in Google Analytics and variable in Tag Manager are the same so that it is easier for you to track
By incorporating User ID in cookie: You can pass the UserID in the form of a cookie which you can either do through a custom JavaScript code or the DataLayer itself. By storing the User-ID in a cookie you can ensure that the user session persists and you can still track the user behavior even after the user closes the website or accesses the website again without logging in. (Though it only stays applicable until the user clears the cookies)
A JavaScript variable without a cookie: In this case, the UserID is passed to the Google Tag Manager as a custom JavaScript variable which is then directly sent to Google Analytics.
The right step will depend on the type of CRM and the reason behind integration. Though all of these steps can be rather complicated, overwhelming, and often prone to errors. With no dedicated support from Google Analytics, you will need technical support from someone who is well versed in Google Analytics integration.
Step #3: Upload CRM data into Google Analytics
Now that you have unique keys and your Google Analytics is ready to receive data, it is now time to upload CRM data.There are two ways you can do it:
1- Data Import
With the Data Import option, you can upload your CRM data as CSV files directly to Google Analytics. You can do this either manually through the user interface or through automatically with the Google Analytics API.Though it’s worth noting that users who don’t visit the website up to 30 days before the data upload are only added to remarketing lists after their next visit. While this might not be an issue if you regularly upload your CRM data in an incremental manner, but if you don’t have the time or the resources to upload CRM data periodically, this option may not be a viable choice.
2- Measurement Protocol
With the Measurement Protocol, you can directly send raw data to Google Analytics. While it’s similar to uploading your own CSV data, this method is more customizable and powerful. Measurement Protocol allows you to make HTTP requests to send all the raw user data from CRM to Google Analytics servers.You can use measurement protocol for a multitude of things, including:
- Integrating online and offline customer behavior
- Importing data from both client and server-side
- Accurately measuring user activity in new environments
- Trigger remarketing lists directly
The challenges in integrating CRM with Google Analytics
- You will invariably need the support to tech teams to handle data export and integration
- The entire process will be time-consuming and require extra effort
- You will be sharing your business information with Google
The best way to go about here is using EasyInsights - it automates the entire process, and provides both ETL and reverse ETL capabilities to the user
-
Even though you do not get Views in GA4, you can use standard GA4 reports and filters to create something similar to Universal Analytics’ View option. To do that, head to the navigation bar on the left side of your screen and click on the Reports section. You will see options like Realtime reports, Life cycle reports, etc.
Now, expand the Life cycle reports section and then select Engagement reports. The Engagement reports section has two reports – Overview and Events. And all reports you create that have filters appear below them.
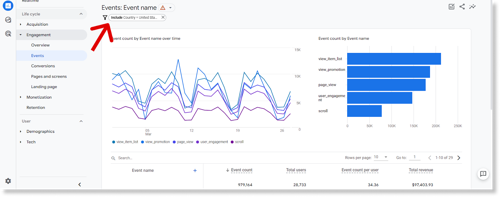
For instance, let us create a view to filter our website traffic that comes only from the United States.
- First, we will open the default Events report and click on Customize report option displayed as a pencil icon in the top-right portion of your screen.
- Clicking on the Customize report option will bring up several dimensions which you can use to filter data. Since we want to see traffic data coming from the US, we will select the dimension as Country and set the condition as the United States. Apart from the country, you can use dimensions like demographics, platform/device, campaign, users, video title, and more.
- Save this report as a new report, and then you can access it in the GA4.
Here is what our report for US traffic looks like:
You can also create your own collection of custom reports for quick access. Just click the Edit collection button and move your new custom report to a preferred place in your collection.