

Today, it’s not arcane wisdom that understanding user behavior and optimizing online experiences are paramount to success. And being an online business, you will have many data sources once you get up and running, like your website, social media, and CRM, just to name a few. But what you really need is a robust web and marketing analytics tool like Adobe Analytics to make sense of all that raw data.
Adobe Analytics is one of the most complete packages for marketers. It has comprehensive reporting capabilities but equally focuses on the analysis part of your job. That is why if you are new to analytics platforms or coming freshly off a basic reporting tool, you have some learning curve to overcome.
So, let’s help you understand how Adobe Analytics works in this blog. We will also explore its key features and walk you through different reports you can access in Adobe Analytics.
Jump ahead to:
Adobe Analytics Overview
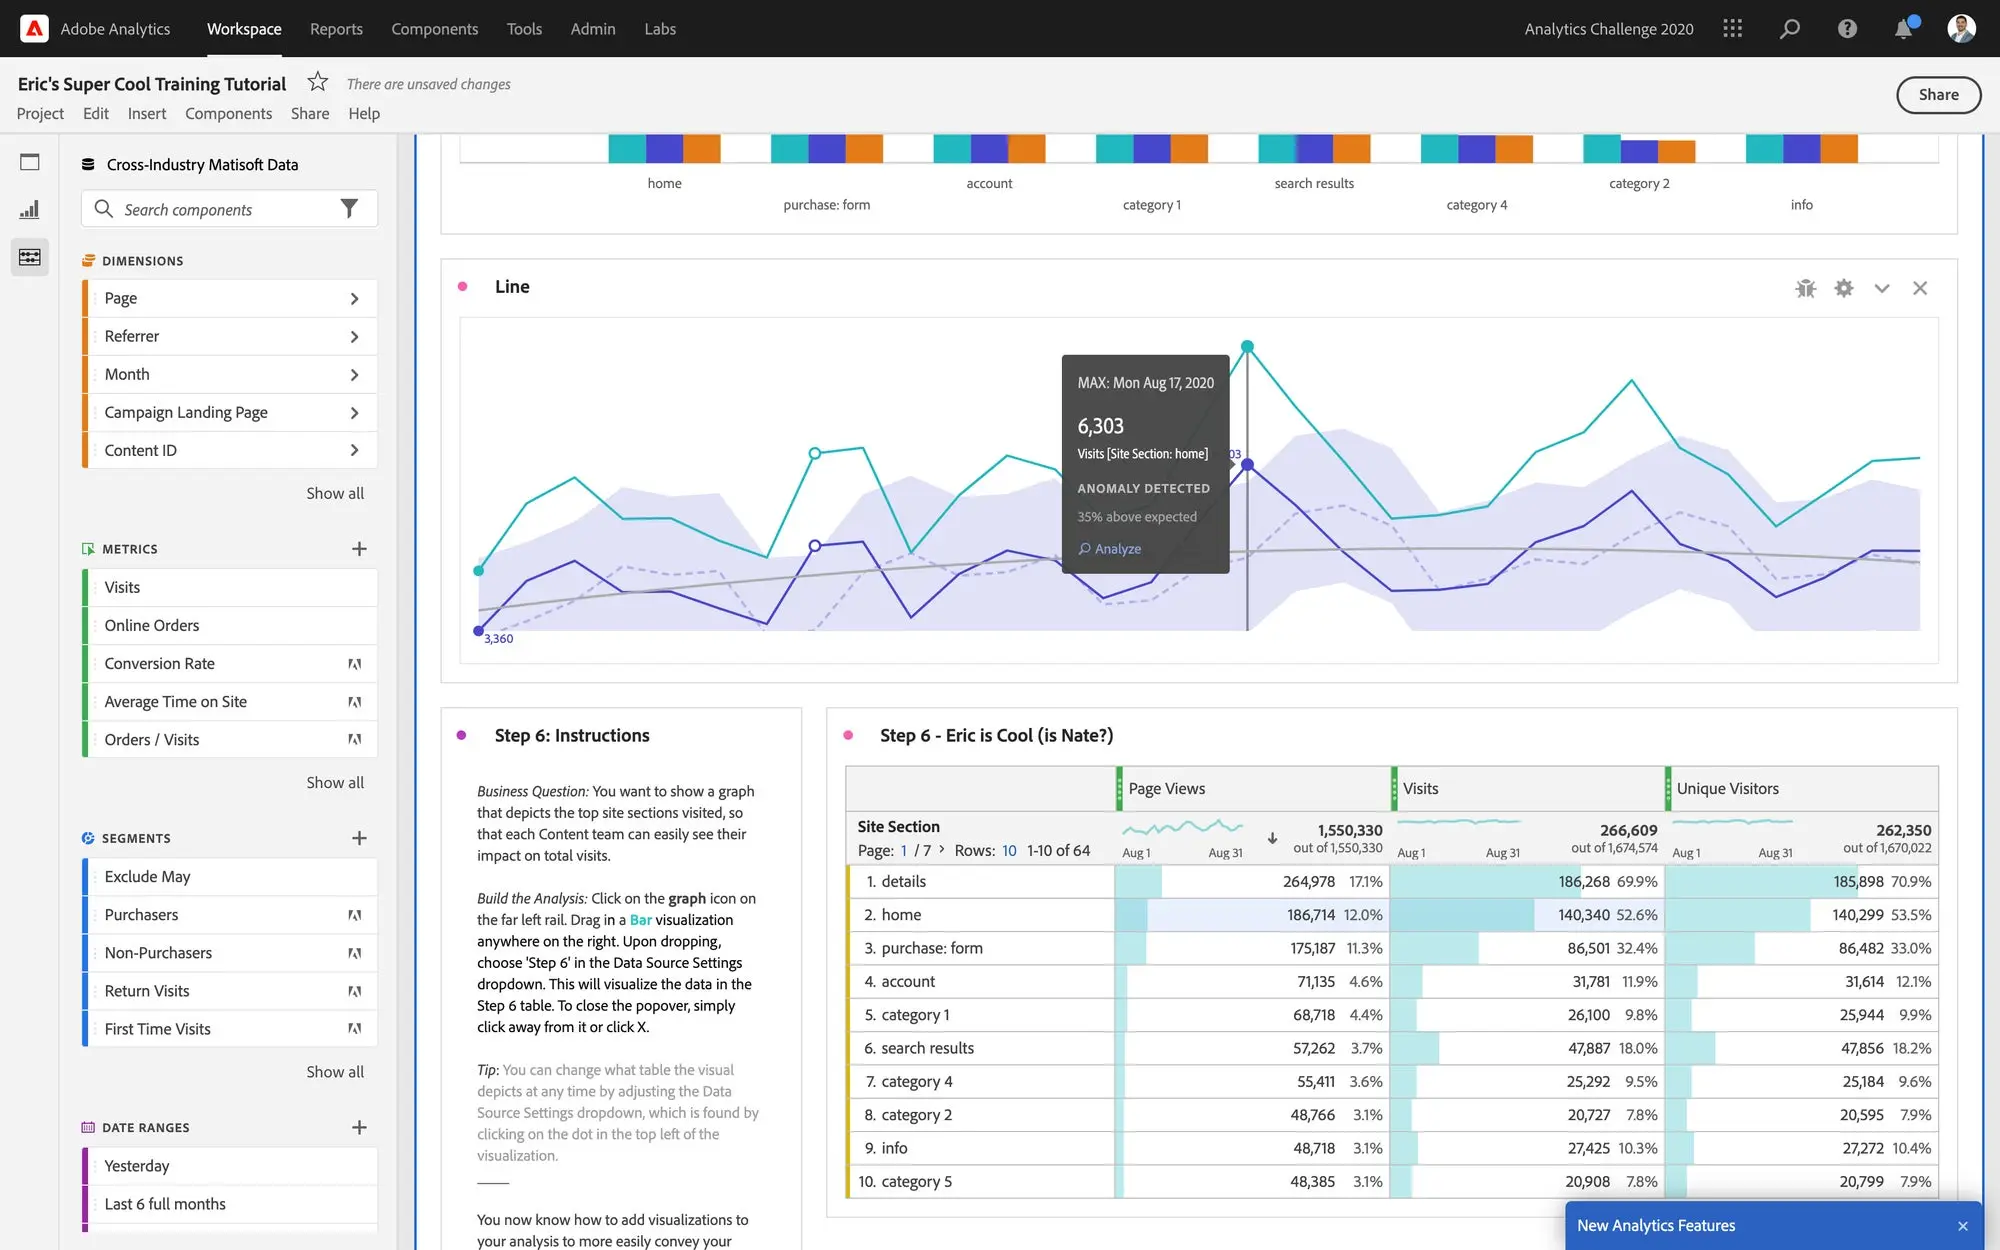
Adobe Analytics is a powerful web and marketing analytics platform developed by Adobe Systems. It is part of the expansive Adobe Experience Cloud, formerly known as the Adobe Marketing Cloud.
Like Google Analytics and other tools, Adobe Analytics enables marketers and analysts to collect data from multiple sources, analyze it, and extract actionable insights. You can track user behavioral data, and measure different KPIs to get a clear picture of your website traffic, customer journeys, and campaign performance.

Adobe Analytics is a paid tool, and its pricing varies based on website traffic and hits recorded. There is no free version, but you can create a trial account to try some of its features before paying for the full software.
The Adobe Analytics Data Model
Adobe Analytics uses a data model very similar to the hierarchical model used in Google’s Universal Analytics platform. Adobe Analytics uses what it calls the nested-container model. It collects data with the hierarchy of Visitor > Visits > Hits.
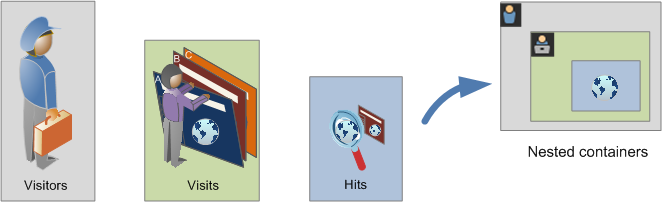
Here’s what it means:
- A visitor is a user visiting your website. Here, a visitor is not identified as an individual but as a browser used to visit your website.
- A visit is a session that represents a visitor’s engagement with your website. It is basically a collection of hits that occur over a certain period. Adobe Analytics records a new visit when:
- A user remains inactive for 30 minutes,
- A user remains active for 12 hours without 30-minute gaps,
- A user generates 2500 hits without starting a new session,
- A user generates 100 hits in 100 seconds.
- A hit is a visitor’s interaction with your website during a visit. It could be a page view, button/link click, form submission, transaction, or any custom event.
Additional Reads: Google Analytics 4 vs. Adobe Analytics: Which one should you choose?
Key Features of Adobe Analytics
Now let’s explore in detail what Adobe Analytics brings to the table:
1. Multi-Channel Data Collection by Adobe Analytics
Adobe Analytics comes with what’s called Report Suite. It allows you to collect data from different channels, including the web, mobile app, ad campaigns, and emails. As a result, you get a centralized repository of all your web and marketing data in Report Suite.
Not only that, the platform also supports offline data integrations. You can collect data from offline sources like call centers, web servers, etc., and unify it with your website or CRM data.
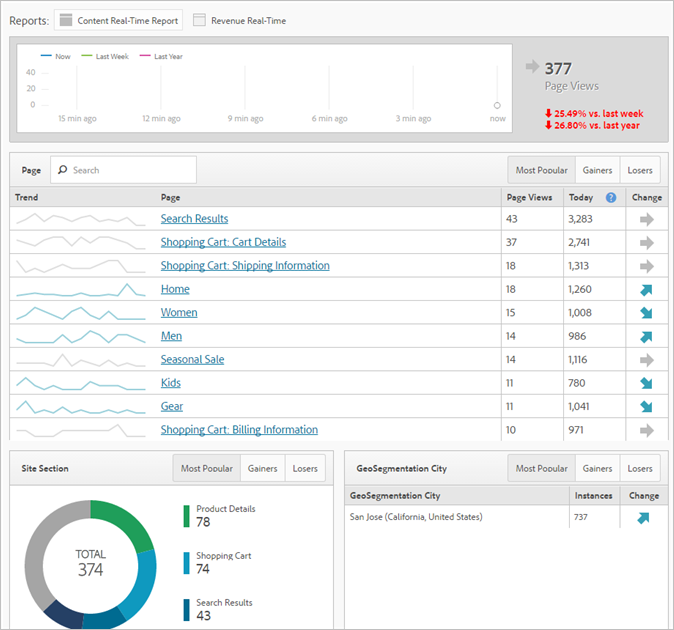
2. Data Visualization and Real-Time Reporting
Once you have collected data, you can use dashboards with visualizations and tables for reporting. You can pick from the predefined metrics and dimensions to create detailed reports. Or you can also create custom variables for reporting conversions relevant only to your business.
Additionally, you can collect data and create dashboards for real-time reporting. Adobe Analytics offers quite a few real-time metrics and dimensions for this purpose.
3. Cross-Device Analytics through Adobe Analytics
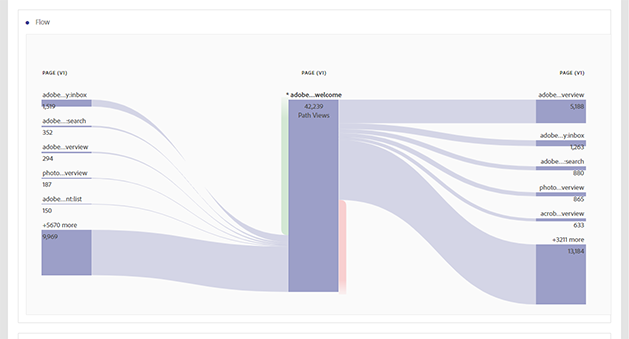
Adobe Analytics’ multi-channel data collection and reporting isn’t siloed. The platform is perfectly capable of linking data for audiences using different browsers and devices. As a result, you get more individual-centric analytics, allowing you to accurately map audiences’ interactions across their customer journey.
Apart from that, you also get flow analysis, essential for identifying different customer paths and the stages in the customer journey. Insights from flow analysis help you create personalized customer journeys.
4. Segmentation and Cohort Analysis
With segments, you can identify and analyze data for subsets of audiences based on their features, behavior, and interactions. You can also share these segments and use them to analyze multiple product data.
Similarly, you can create cohorts to analyze audiences sharing common features over a specified period. You can pick dimensions, metrics, and segments for your cohort tables and share them with your team.
5. Ad Analytics and Remarketing
If you publish display ads on social media, search engines, and e-commerce platforms, you can measure different PPC KPIs in Adobe Analytics, like impressions, ad clicks, CPC, and more. You can also integrate Adobe Analytics with Adobe Campaign to add triggers for remarketing your customers based on actions like sign-ups, email subscriptions, abandoned carts, etc.
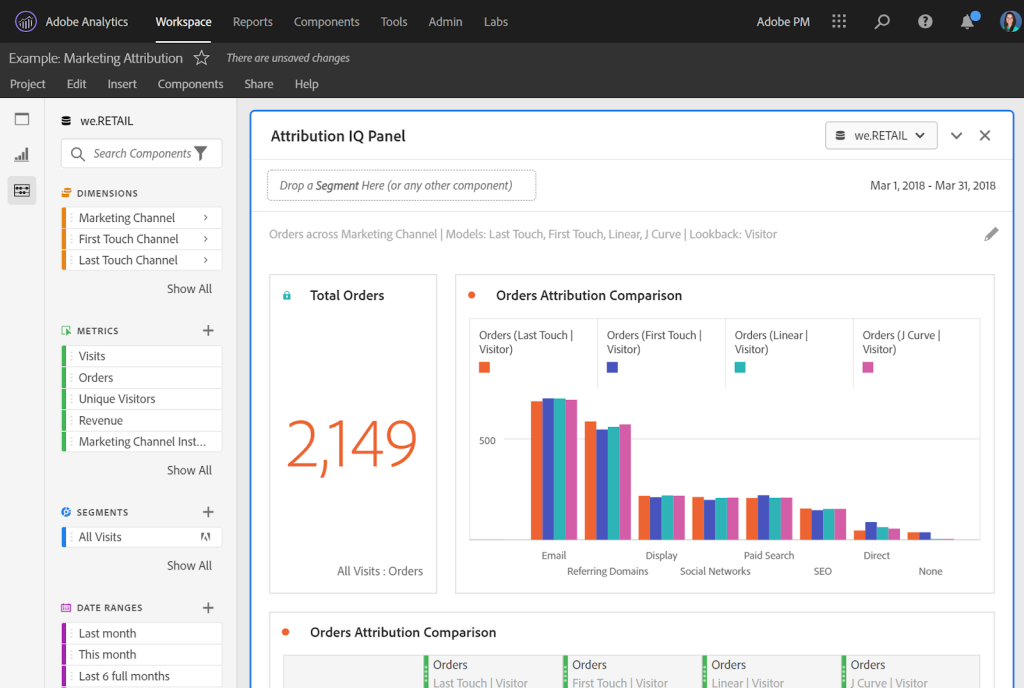
6. Marketing Attribution
Attribution models, as you know, are an essential element of a modern analytics tool, allowing analysts to assess the contribution of different channels toward a conversion. Adobe Analytics includes all necessary predefined single and multi-source attribution models.
You also get algorithmic attribution that uses statistical techniques and machine learning to assign credit. Also, attributions in Adobe Analytics aren’t limited to just paid media. You can apply attribution to any channel, metric, and dimension.
Additional Read: Everything You Need to Know About Marketing Attribution Models
7. Predictive Analytics
Adobe Analytics also comes with predictive analytics features like anomaly detection, contribution analysis, and smart alerts.
The anomaly detection report helps you identify extreme fluctuations in data, like spikes and dips in metrics such as order value, clicks, etc. Contribution analysis, on the other hand, uses machine learning and algorithms to identify the causes that lead to those anomalies.
Together, anomaly detection and contribution analysis help you detect any fraudulent activities on your website and take measures to stop them without causing further damage.
Once you have identified an anomaly, you can create intelligent alerts that will trigger if the anomaly occurs again. You can decide how much deviation in metric should trigger the alert. At the same time, you can set alert frequency and send alerts using email or SMS.
Types of Reports Available in Adobe Analytics
Adobe Analytics has one of the most comprehensive reports catalogs to help marketers track everything from web traffic to ad spend. Every report focuses on specific metrics. And you can add dimensions and custom events to them for more granular analysis.
Here is their detailed overview:
1. Adobe Analytics Site Metrics
As the name suggests, these reports help you track your website’s incoming traffic. You can access the following site metric reports in Adobe Analytics:
- Recommended Reports: These reports are like thumbnail reports called “Reportlets” used for analyzing data at a glance. They are used to create dashboards.
- Key Metrics: This report shows data for up to five metrics at a time. By default, it shows data for Page Views, Visits, and Unique Visitors.
- Real-time Reports: These reports show data for different site metrics in real time. You can create up to three real-time reports in one Report Suite. The metrics in these reports can have one primary and two secondary dimensions.
- Page Views: This report shows the number of page views garnered over time.
- Visits: The visits report shows the number of sessions on your website over a specific period.
- Visitors: This report shows the total number of unique visitors over time, like hourly visitors, daily visitors, weekly visitors, and so on.
- Time Spent Per Visit: This report helps you track users’ time on your website. Adobe Analytics records the time at the first hit and then at the last hit to calculate the time spent on a visit.
- Time Prior to Event: This report helps you track the time between the first hit in a visit and any desired event or metric, like form submission, checkout, etc.
- Bots and Bot Pages: Bot reports show how often bots visit your site. Bot pages report, on the other hand, shows which pages attract the most bot visits.
2. Traffic Sources
Traffic sources collection of reports gives you insights into how visitors arrive on your website. You get reports for the following dimensions:
- Search keywords: You get reports to track keywords that bring traffic to your website. You can create reports for all, natural, or paid keywords.
- Search Engines: These reports show search engines used to visit your website. They also have three dimensions – all, natural, or paid.
- All Search Page Ranking: This report helps you identify the page of the SERP results where your site appears.
- Referrer and Referrer Types: Referrer reports tell you the exact URL users click to reach your website. On the other hand, referrer type reports show data for channels where the URL was clicked, like social media, hard drive, typed, bookmarked, email, etc.
3. Site Content
While site metrics and traffic source reports give you an overview of your website traffic, site content reports help you track how users interact with your content, focusing on content-specific dimensions. Some site content reports are:
- Page: This report tracks page dimension that lists the names of pages on your site. It helps identify pages with the most or least visits.
- Site Section: The site section report shows the names of your site’s different sections. It helps you find sections that have the best performance.
- Servers: If you collect data from multiple domains and sub-domains in a report suite, server reports help you find domains that perform the best.
- Links: These reports help you track links on your site, like exit links, broken links, file download links, and custom links.
4. Mobile
This collection of reports helps you track mobile users using dimensions like device type, manufacturer, screen size, screen height and width, operating system, and more. You can access separate reports for each mobile-related dimension.
3. E-Commerce
As the name suggests, these reports help you track E-Commerce centric metrics and dimensions. Some E-Commerce reports available in Adobe Analytics are:
- Product Reports: These reports track dimensions like products and categories. You also get funnel reports that help you track product views, products added to the carts, checkouts, orders, and revenue.
- Purchase Reports: These reports focus on purchase-centric metrics like units, orders, and revenue. You can also use these dimensions to create purchase conversion funnel reports.
- Shopping Cart Reports: These reports cover cart-centric metrics like items added to the cart, checkouts, orders, and revenue. These metrics can also be used to create cart conversion funnel reports.
6. Visitor Profile
Visitor profile reports let you perform a granular analysis of visitor data. Basically, these reports answer questions like who exactly your visitors are, where they originate from, and what devices they use. Some of these reports are:
- Geo-Segmentation: These reports tell you about the countries, regions, cities, and zip codes where traffic to your site originates.
- Language and Domains: You also get reports for languages in which users prefer to consume your content. Similarly, domain reports track access points used to access the Internet.
- Technology: These reports track the tech used to access your website. They include dimensions like browser type, browser height and width, operating system, monitor resolution, Java, cookies, and more.
Additional Read: 6 Data-Driven Marketing Strategies That Are a Game-Changer
7. Marketing Channels
Marketing channels reports give an overview of your marketing efforts using your different channels as dimensions. Metrics in these reports are calculated using the first- or last-touch attribution model.

8. Paths
Path reports in Adobe Analytics help you map different flows of actions that users perform on your website. Then, you can easily identify how users interact with your website and understand their behavioral flow. Some pathing reports available to marketers are:
- Next Page and Previous Page Flow: The next page flow shows the next pages visitors accessed while the previous page flow shows the previous pages visitors arrived from.
- Fallout: This flow report lets you pick a dimension and identify how many visitors followed a path and how many didn’t.
- Path Length: This report simply tells you the total number of pages a visitor accessed in one visit.
- Page Analysis: This report allows you to analyze the number of times a page was reloaded, the number of clicks it took to reach a page, and the time spent on it. You also get page summaries with dimensions like entry points, previous pages, exit points, and subsequent pages.
Adobe Analytics and New Data Protection Regulations
It’s no news that analytics tools have been under scrutiny across different countries. The major issue that privacy advocates have with such platforms is their use of cookies to track user behavior and cross-border sharing of data.
This has led to several privacy laws regulating businesses’ collection, storage, usage, and sharing of user data in different parts of the world. European General Data Protection Regulation (GDPR), California Consumer Privacy Act (CCPA), and Brazilian Lei Geral de Proteção de Dados (LGPD) are some popular examples of such laws.
As per the EU’s GDPR, it is illegal for companies to use Google Analytics and Facebook Connect in Europe without taking measures like data anonymization.
Adobe Analytics is also an American product. It also collects tons of user and marketing data. It even tracks user behavior via third-party cookies.
So, does Adobe comply with today’s privacy standards and regulations? According to Adobe, they do. Here’s how the platform is trying to remain compliant with new privacy norms:
1. Certified-Cross Border Data Transfer
As mentioned earlier, their data storage and sharing policy was the biggest argument against analytics platforms. For starters, Adobe’s privacy policy completely discloses the fact that they transfer your data to the US and other countries.
So, if you use the platform to collect and analyze user data, Adobe Analytics, and its usage should be disclosed in your privacy policy.
Second, Adobe is certified with the EU-US and Swiss-US Privacy Shield Framework. Businesses can rely on this framework when sharing user data across borders.
2. Adobe Experience Platform Privacy Service
To remain compliant with the new data and privacy norms, Adobe implemented what it calls Adobe Experience Platform Privacy Service. The privacy service provides brands with RESTful API and interfaces to manage customer data.
Using this privacy service, brands can submit requests to access and delete personal user data collected from Adobe Analytics and other tools available in Adobe Experience Cloud.
Apart from that, the platform has a data retention policy of 25 months, which brands can extend to a maximum of 10 years and 1 month by purchasing an extension. Any data stored after the retention period is automatically deleted.\
3. Privacy Documentation
Privacy compliance is your responsibility as much as it is Adobe’s. And the company realizes this. So, it has provided detailed documentation to help marketers and analysts understand how the platform works. In its Privacy Overview, the company explains in detail what all data Adobe Analytics collects and how you can remain compliant when using the platform.
Wrapping Up
That is all you need to know about Adobe Analytics. It offers tons of features to create advanced analytics workflows. Whether you want to track website traffic, ad campaigns, or map cross-channel customer journeys, the platform provides all the necessary reports a marketer needs. Besides, you can tailor Adobe Analytics to your brand’s analytics needs using custom events, dashboards, and reports.
If you are looking for a data activation platform that can act as central hub for all your marketing data, check out EasyInsights. This advanced analytics tool allows you to sync data from 200+ marketing sources, including analytics platforms like GA4 and Adobe Analytics, eCommerce stores, social media, CRMs, etc.
EasyInsights also lets you perform attribution modeling, segmentation, server-to-server integration, and conversion API implementation to make the most out of your first-party data. This increases your ROAS by up to 25%.


