Acquiring new customers is essential, but retaining your existing customers is how you grow your business. In fact, according to research, acquiring new customers costs you five times more than it costs to retain the existing ones. But what should you do if your customers churn after the first few interactions with your product? How do you tap into the reasons that cause them to churn? Cohort analysis is the answer.
In this blog, we will help you understand what cohort analysis is and some best practices you should follow. We will also walk you through the steps to prepare a cohort exploration in Google Analytics 4. So, let’s dive straight in.
Jump ahead to:
What do you mean by Cohort Analysis?
Cohort analysis is a behavioral analytics technique that divides the voluminous and complex data into smaller groups sharing common characteristics within the defined time span. The purpose is to identify trends and patterns arising from subjects having similar features. “Cohort” is basically a technical name for a group.
In digital marketing, cohort analysis is used to analyze the behavior and performance of different user/customer groups based on characteristics like acquisition and engagement. For instance, you can divide your customers based on the week or month of acquisition and assess their engagement using events like site visits, average session duration, average order value, etc.
Cohort analysis helps marketers understand the behavior of their customers across their life cycle. At the same time, it allows marketers to measure their marketing campaign’s effectiveness and optimize their strategies for targeting these different groups.
What are the Two Types of Cohort Analysis?
Now that we have understood what cohort analysis is, let’s review its different types.
1. Acquisition Cohort Analysis
Acquisition cohort analysis is a commonly used type wherein marketers divide users into groups based on when they signed up for their product or started using it. It helps assess and compare user behavior, measure the performance of different cohorts, and optimize customer retention strategies.
2. Behavioural Cohort Analysis
As the name suggests, this type of analysis groups users based on specific actions like their order value, purchase frequency, feature adoption, or even how they interact with your campaign.
Behavioral cohort analysis aims to identify user behavior that signifies better customer retention. In other words, it helps marketers identify high-value cohorts to tailor their marketing efforts for these segments.
Why Is Cohort Analysis Important in Digital Marketing?
Here are some reasons why cohort analysis is essential for digital marketers:
1. Tap into User Behavior
We all can agree that every marketer wants insights into how users behave over time. That is the only way to make digital marketing fruitful. And cohort analysis lets you do exactly that.
You can divide your entire user base into smaller groups or cohorts based on their shared features, like their time and date of acquisition. Alternatively, you can also create cohorts based on how they engage with your product.
This makes it easier for you to observe trends and identify the preferences of different user groups. As a result, you can create more focused strategies to target each user.
2. Measure Marketing Performance
The next reason why cohort analysis is critical is that it helps you benchmark your marketing efforts. You can assess the impact of your campaigns on conversion rate, retention, revenue, and other KPIs for different segments in your user base.
You can experiment with different marketing strategies and test their performance to pick the right channels and mediums to target different cohorts. It helps you optimize your budget allocation and reduce the wastage of marketing resources.
3. Improve Customer Retention
According to HubSpot, improving customer retention by 5% can boost profits by over 25%. That is why you want your customers to keep using your product, not just purchase it once. Or if you have an app, you want them to download it and use it regularly.
Using cohort analysis, you can measure the retention rates of different user cohorts. At the same time, you can identify the factors that lead to better retention and the ones that lead to churn. This helps you understand the needs and wants of different user groups.
As a result, you can easily take steps to improve customer retention, whether it is introducing new features, giving more targeted offers, or improving your customer onboarding process.
4. Personalize UX
Personalization is the most effective technique to boost customer loyalty toward your brand. In fact, around 70% of the marketers that use personalization see over 200% RoI on their marketing efforts. And cohort analysis helps you personalize user experience at scale with ease.
Cohort analysis offers insights into how different user groups interact with your brand messaging and campaigns over time. Based on that, you can tweak your messages and promotional offers to better resonate with different target groups. It leads to improved customer satisfaction boosting engagement and conversions across cohorts.
5. Improve Your Product
Lastly, you can also use cohort analysis to improve your product. For instance, if you have an app, cohort analysis provides the perfect opportunity to test it based on the usage patterns of different groups.
Besides the regular feedback you collect, you can create cohorts based on feature adoption, product version, other usage patterns, etc. This will help you identify and prioritize product enhancements that align with your users’ needs.
What is Cohort Analysis in GA4?
Google Analytics 4 provides the most convenient way to do cohort analysis. It has a built-in cohort exploration report template to create cohorts based on predefined segments and dimensions to metrics like tracking active users, event count, purchase revenue, and more.
A. Creating Cohort Exploration in GA4
Let’s go through the steps of creating a cohort exploration report in GA4.
Step 1. Login to your GA4 property.
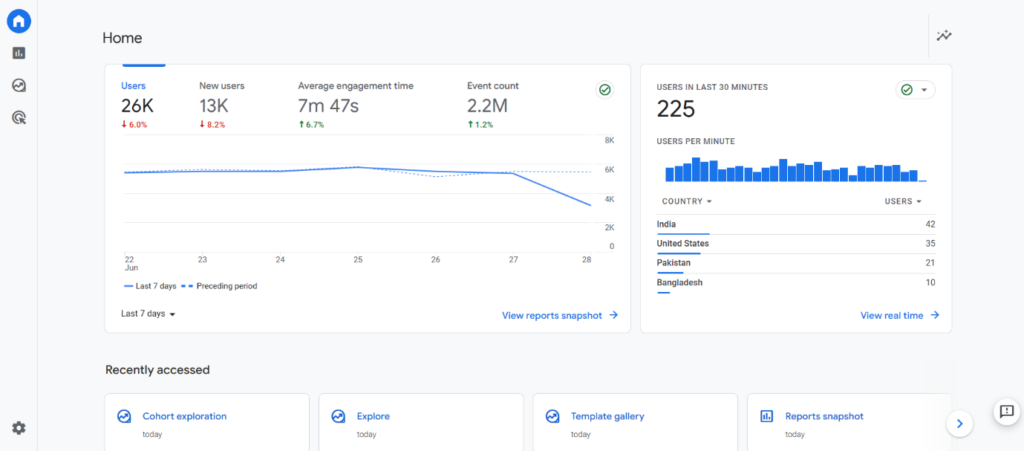
Step 2. Head over to the Explore section in the navigation menu on the left side of your screen.
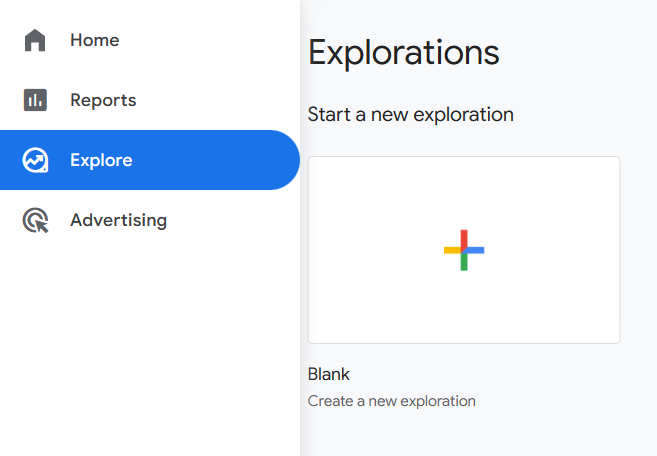
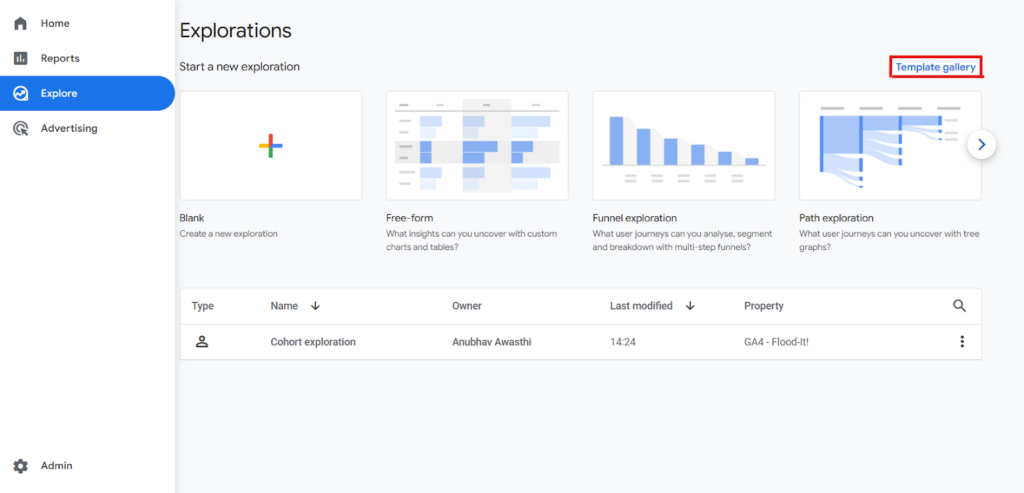
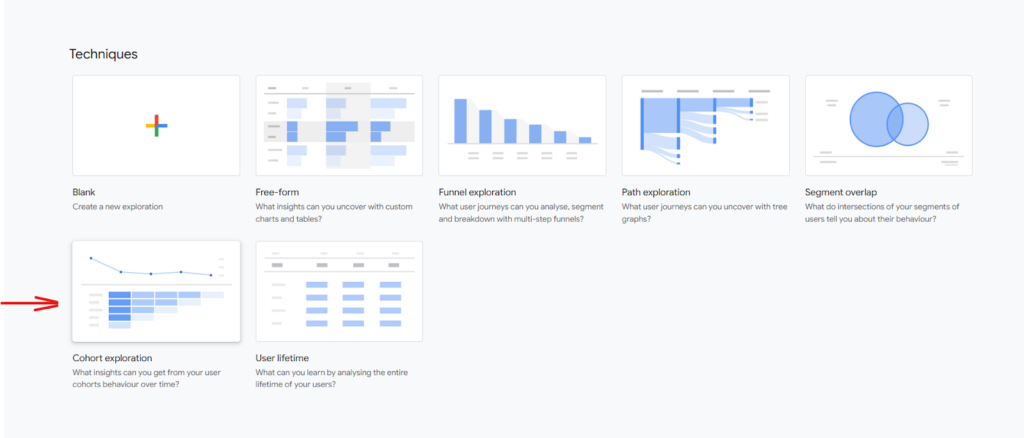
Step 3. Now, look for the Template Gallery option. Click it and select Cohort Exploration.
Step 4. Now you will see the default cohort exploration, which shows the sum of active users in weeks after the acquisition date.
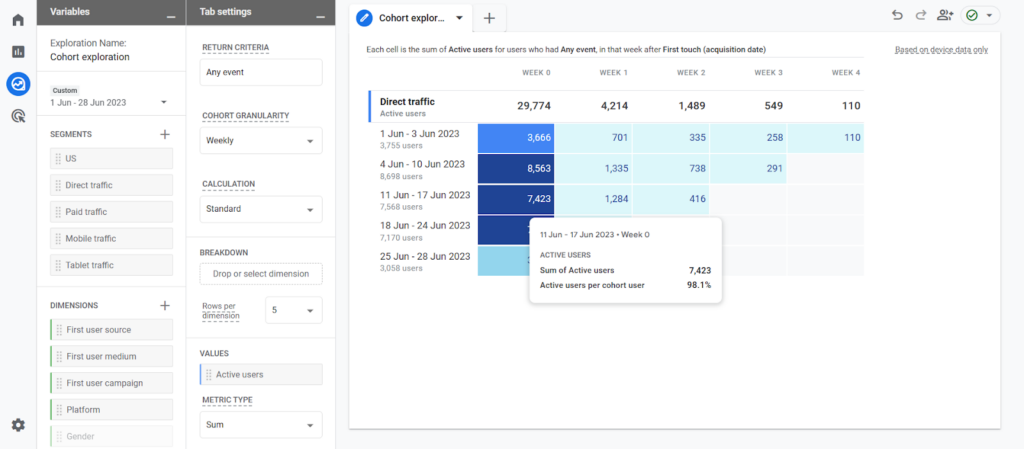
B. Configuring Cohort Exploration in GA4
We can configure GA4 cohort exploration based on what marketing questions we need answers for. We can pick from predefined segments or create custom segments based on users, sessions, and events.
Similarly, we can pick dimensions to break down cohorts to see details like gender, platform, device, and more.
Let’s have a look at some configuration options available within GA4 cohort exploration.
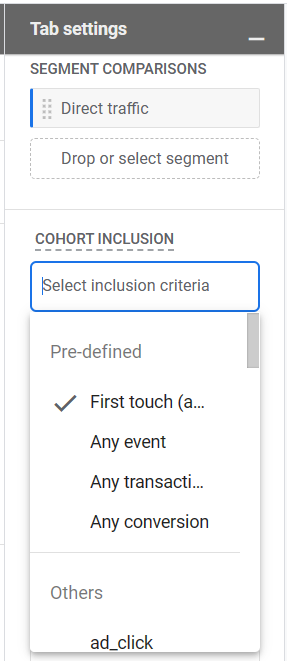
1. Cohort Inclusion
As the name suggests, cohort inclusion allows you to select the criteria that users must fit to be a part of your exploration. You can pick from these criteria:
- First touch (acquisition date): This is the first time a user has visited your website or app.
- Any event: It is the first event that a user generates within the exploration period.
- Any transaction: It is the first transaction event that the user made within the selected period.
- Any conversion: The first conversion event the user generates in the given date range.
- Others: Other than the four predefined events, you can pick from a range of other events as inclusion criteria like ad click, app update, app uninstalls, first visit, etc.
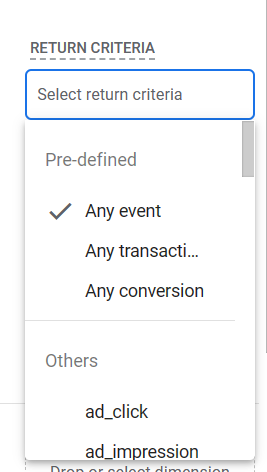
2. Return Criteria
Return criteria option allows you to pick a returning condition that users must satisfy to be included in your exploration. Some return criteria available in GA4 cohort exploration are:
- Any event: This criterion requires the user to have at least one event within the selected date range.
- Any transaction: This return condition requires the user to have at least one transaction within the selected date range.
- Any conversion: The user must have at least one conversion within the exploration date range.
- Others: Similar to the inclusion criteria, you can pick some additional events other than the predefined ones that users generate within the exploration period.
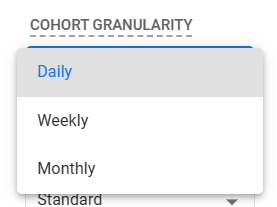
3. Cohort Granularity
Cohort granularity is where you decide the initial and return cohort time frame for your exploration. You have three options:
- Daily: Selecting daily granularity shows data from midnight to midnight according to your property’s time zone.
- Weekly: Includes cohort data from Sunday to Saturday.
- Monthly: Shows data from the beginning of the month till the end.
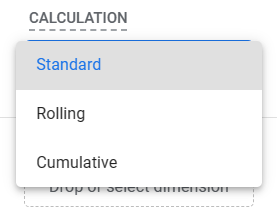
4. Cohort Calculation
This option allows you to select the method for calculating metrics for the specified time frame. You can pick from these three calculation methods:
- Standard: This method includes all users who meet the return criteria for the selected time frame in each cell of your exploration, irrespective of their activity in other periods.
- Rolling: In this calculation, each cell includes users who meet the return criteria for the set period as well as previous periods.
- Cumulative: Cumulative calculation method include all users in each cell who meet the return criteria in any period.
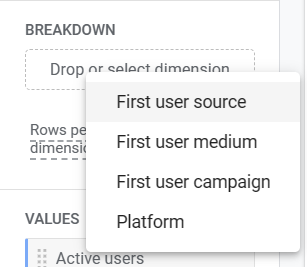
5. Breakdown
This option allows you to divide your cohorts into sub-groups. You can split your cohorts using dimensions like gender, platform, device, etc.
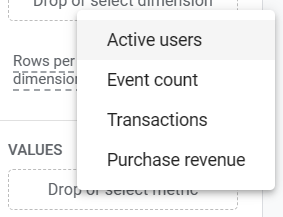
6. Values
The values option is where you pick the metric you want to track for your cohorts. You get four predefined metrics – active users, event count, transactions, and purchase revenue. You can also pick events other than the predefined events.
Additional Read: How to Reduce CAC to Improve LTV:CAC Ratio?
Best Practices for Cohort Analysis
Before you begin your cohort exploration, there are some best practices that you must know of. Some of them are as follows:
1. Have a Clear Objective
To uncover meaningful insights from your cohort analysis, you must begin by asking the right questions. Have a clear objective in mind for your analysis, like whether you are looking to find your most valued customers or reasons that lead to churn.
You can also use cohort analysis to test your hypothesis. For instance, did the recent feature update to your product increase engagement? Cohort analysis will help you substantiate your claims.
2. Define Meaningful Cohorts
Once you set your objective, the next important practice is creating the right cohorts. For example, if you want to identify which groups have better retention, your cohorts should be based on acquisition. However, you should use behavioral cohorts if you are delving into reasons for their churn.
3. Take Actionable Steps
Once you have the insights you wanted from your cohort analysis, you must turn them into actionable steps. Use the insights to improve your marketing campaigns, aid your product development, and create strategies to boost retention and engagement.
4. Test and Optimize
Cohort analysis is a process of regular monitoring, implementing corrective measures, and testing the effectiveness of your actions. So, regularly test how your actions impact customer retention. Compare the past performance of your cohorts against the new data and optimize your strategies for better results.
Wrapping Up
Cohort analysis is a vital marketing analytics technique that you should use to measure customer retention. You can identify consumer sects that bring more business. At the same time, you can gauge the causes of why some groups churn. Equipped with these insights, you can easily create strategies to implement to improve customer retention across cohorts.
While GA4 is an excellent tool for cohort analysis on your website and app traffic, things get tricky when analyzing cross-platform data. That’s when you should turn to EasyInsights.
With EasyInsights, you can collect data from different sources like GA4, Facebook, Amazon, Shopify, and countless other e-commerce, CDP, CEPs, data warehouses and marketing analytics tools.
Besides, you can clean and harmonize data and avail of many customized services, including cohort analysis, customer segmentation, omnichannel attributions, and more. Here’s how EasyInsights works –
Bonus Read: How EasyInsights works with Raw GA4 Data for Data Activation and Enrichment
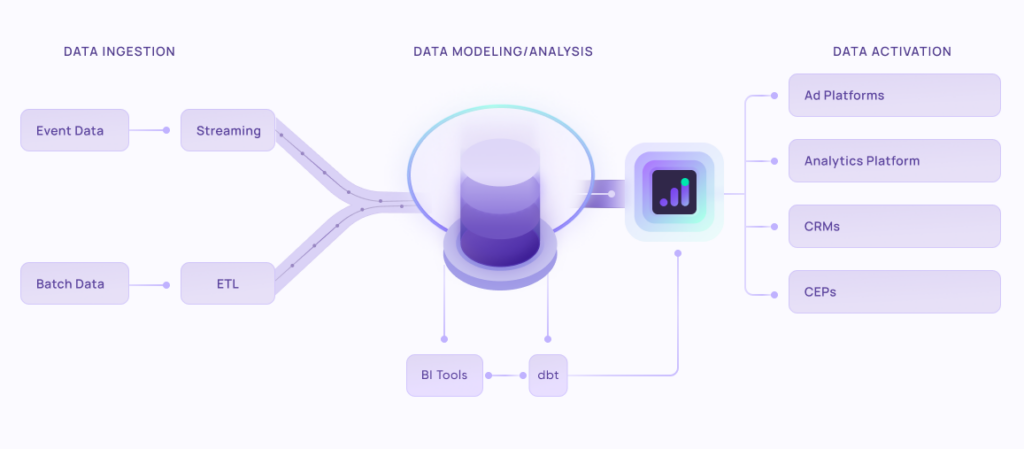
EasyInsights works with raw GA4 data for data activation and data enrichment in a few key ways:
Data Collection and Transformation:
- EasyInsights connect directly to your Google Analytics 4 property allowing it to access and extract the raw GA4 data you’ve collected.
- Data Transformation: EasyInsights then cleans, normalizes, and enriches the data to make it usable for activation purposes. This may involve tasks like:
- Formatting data: Ensuring all data points are in a consistent format.
- Handling missing values: Filling in missing data points or removing them according to your preferences.
- Enriching data: Adding additional data points from other sources to create a more comprehensive picture of your customers.
Data Activation:
- Segmentation and Targeting: It allows you to segment your audience based on various criteria like demographics, behavior, and interests using the enriched GA4 data.
- Multi-channel Marketing: You can then use these segments to activate your audience across different marketing channels like email, social media, and advertising platforms.
- Customer Relationship Management (CRM): The data can be used to personalize outreach and interactions with customers within your CRM system.
- Marketing Attribution: EasyInsights can help you understand how different marketing channels contribute to conversions and optimize your marketing spend accordingly.
Key Feature:
- Offers features like customer data platform (CDP) capabilities, marketing automation, and campaign management tools.
- Focuses on reverse ETL (extracting data from your warehouse and sending it to marketing tools) and offers pre-built integrations with various marketing platforms.
EasyInsights is a marketer’s preferred tool for first party data activation.
In this age of cross-channel marketing, EasyInsights offers a comprehensive platform to collect, store, and transform all your first-party data.
EasyInsights enhances marketing campaign efficiency in a cookieless landscape with accurate ad signals. It helps brands step away from surface-level metrics and unleash the potential of first-party data to optimize marketing strategies, ensuring a superior Return on Ad Spend (ROAS). It does all this, while being a highly affordable no-code platform with an exceptional customer support apparatus.
Sign up for a demo today to see EasyInsights in action.