Analyzing the output data of a campaign is one of the biggest factors adding to its success. The performance tracking makes it easy for the marketers to work on the remedial measures for something which isn’t working. Google Analytics is one of those tools which provides informative insights into your website, helping you determine the engagement levels and see what’s bringing you down. However, even the most skilled marketers sometimes face challenges while working on google analytics. The data is huge, and the dashboard is not exactly everyone’s cup of tea. That is why in this blog, we have put together an ultimate guide that will assist you in building a comprehensive google analytics report.
Jump ahead to:
Why do Google Analytics insights matter?
Google Analytics reporting allows you to peep inside your visitor’s behaviour across the funnel. If you have ever caught yourself worrying about things like:
- The growth of your homepage
- The most visitor-driving channel
- How many new visitors are you getting
- Conversion rate from your website
- The average time a visitor spends on your website
- And more
Then you will benefit greatly from GA as it can give you the precise answers along with data supporting it to help chalk out crucial strategies for growth.
What should your Google analytics report contain?
You must use structure and storytelling to create a Google Analytics report. The sections of a report should be interconnected, providing continuity and adding segments to the larger data sets.
Ideally, these should be the sections of your report:
Acquisition overview
This is the first thing to include in a GA report as it gives an in-depth summary of the overall health of the website. A glance at this section at the top of the Google Analytics report can provide you with aggregated performance statistics.
User behaviour overview
You will cover the basic user behaviour on your site in your second segment. These metrics will include:
- Average time on a page
- Bounce rate
- Exit rate
- Pageviews per session
You can use user behaviour to learn how your audience perceives your content.
Page bounce rates and conversions
Who wouldn’t want their visitors to read their articles, go through their website and ultimately become paying customers? But, in reality, this is not always the case. Not every visitor who goes through the article gets converted into a customer. Only a marketeer knows the amount of time spent to produce high-quality material. However, there is still a chance to decrease the bounce rate and increase the conversion rate for the other pages of the site. Identifying which pages or souces attract the most footfall will help you in achieving success.
Audience overview
Every firm has a demographic they want to target that is why an audience overview section within your GA report is essential. You can check if your website is engaging your target audience by monitoring its traffic. With this data, you can see what type of interest your intended audience has for your website.
Assessing particular pages
By using Google Analytics, you can track the performance of individual pages and even searches. As granular data is usually overshadowed by the big-picture metrics discussed earlier, this portion should be included at the end.
Bonus Read: How EasyInsights works with Raw GA4 Data for Data Activation and Enrichment
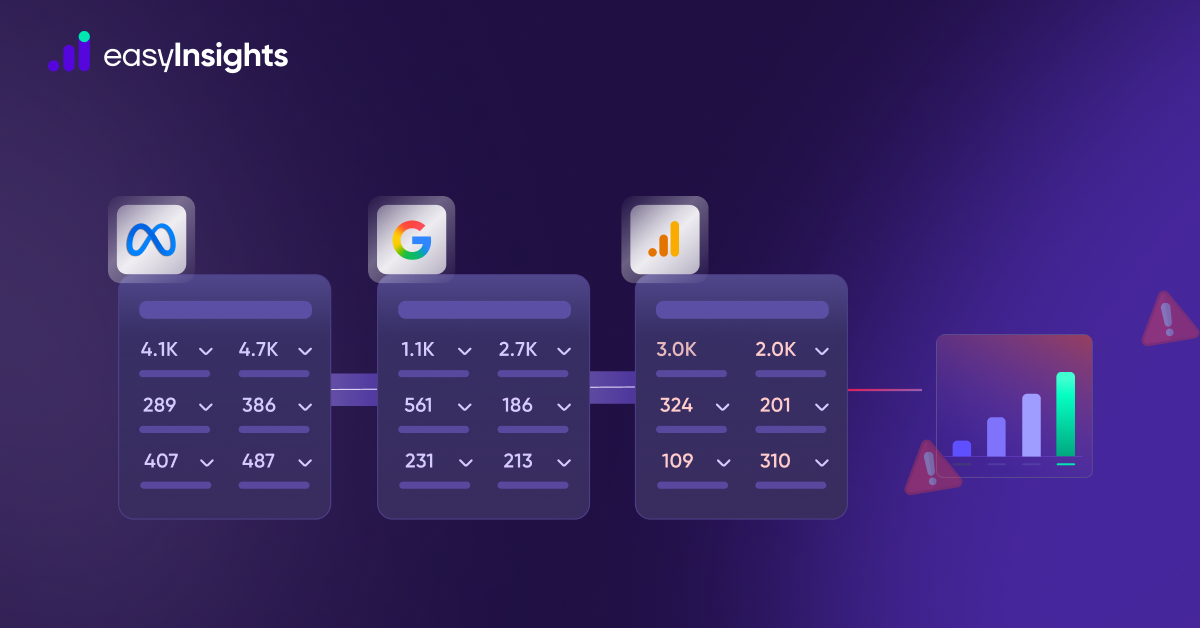
EasyInsights works with raw GA4 data for data activation and data enrichment in a few key ways:
Data Collection and Transformation:
- EasyInsights connect directly to your Google Analytics 4 property allowing it to access and extract the raw GA4 data you’ve collected.
- Data Transformation: EasyInsights then cleans, normalizes, and enriches the data to make it usable for activation purposes. This may involve tasks like:
- Formatting data: Ensuring all data points are in a consistent format.
- Handling missing values: Filling in missing data points or removing them according to your preferences.
- Enriching data: Adding additional data points from other sources to create a more comprehensive picture of your customers.
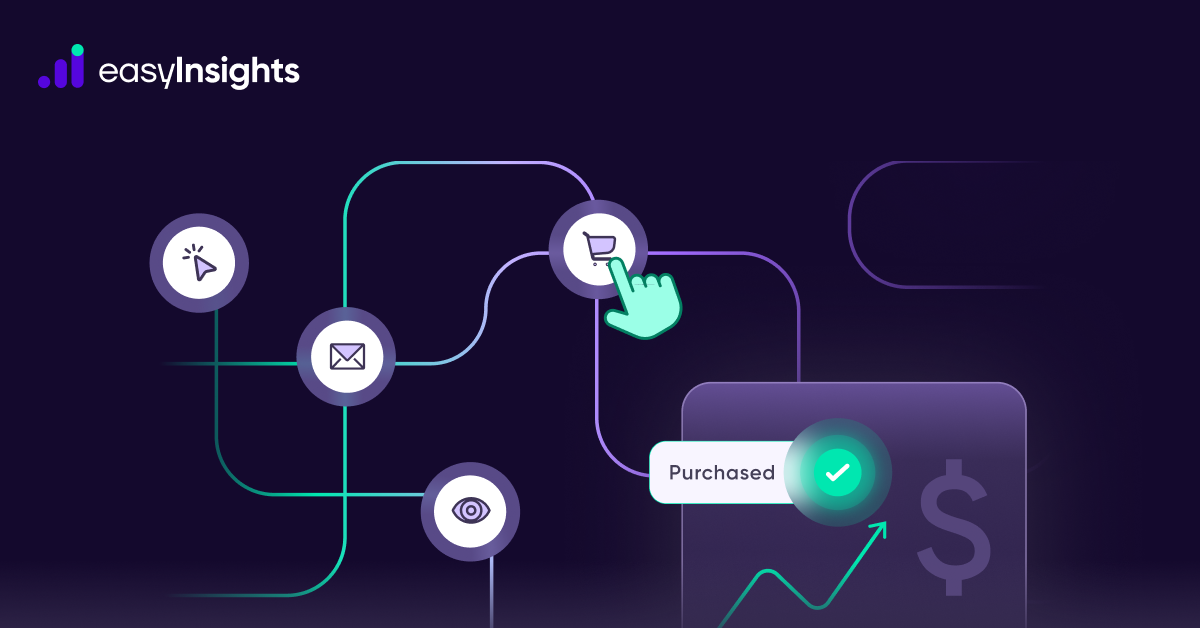
Data Activation:
- Segmentation and Targeting: It allows you to segment your audience based on various criteria like demographics, behavior, and interests using the enriched GA4 data.
- Multi-channel Marketing: You can then use these segments to activate your audience across different marketing channels like email, social media, and advertising platforms.
- Customer Relationship Management (CRM): The data can be used to personalize outreach and interactions with customers within your CRM system.
- Marketing Attribution: EasyInsights can help you understand how different marketing channels contribute to conversions and optimize your marketing spend accordingly.
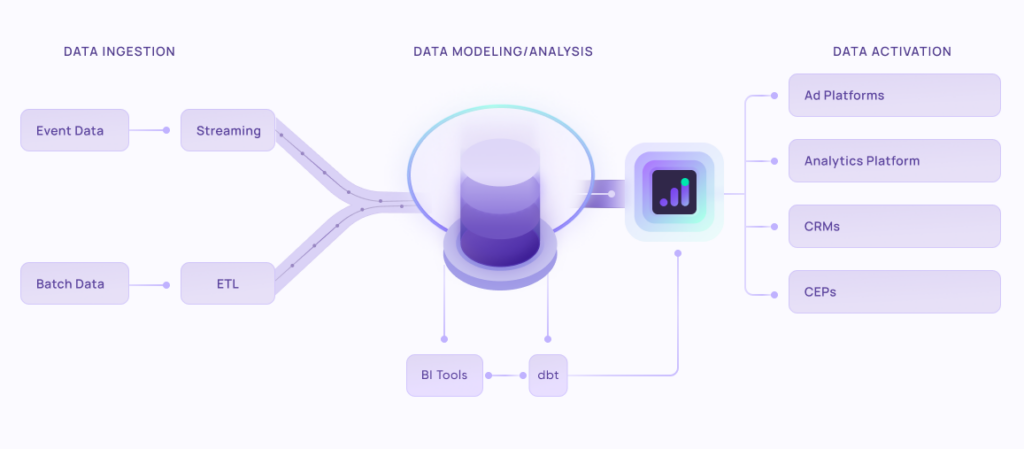
Key Feature:
- Offers features like customer data platform (CDP) capabilities, marketing automation, and campaign management tools.
- Focuses on reverse ETL (extracting data from your warehouse and sending it to marketing tools) and offers pre-built integrations with various marketing platforms.
EasyInsights is a marketer’s preferred tool for first party data activation.
In this age of cross-channel marketing, EasyInsights offers a comprehensive platform to collect, store, and transform all your first-party data.
EasyInsights enhances marketing campaign efficiency in a cookieless landscape with accurate ad signals. It helps brands step away from surface-level metrics and unleash the potential of first-party data to optimize marketing strategies, ensuring a superior Return on Ad Spend (ROAS). It does all this, while being a highly affordable no-code platform with an exceptional customer support apparatus.
Sign up for a demo today to see EasyInsights in action.