Google Analytics 4 (GA4) is the most popular analytics tool on the Internet today. It provides marketers with plenty of reports as standard, like real-time reports, life cycle reports, user reports, and more. These reports give you valuable insights into your website and app traffic. But that is not all. You also get exploration reports, GA4’s equivalent of custom reports in Universal Analytics, but way more functional.
So, what are explorations in GA4, what custom reports do they offer, and how can you create one in your GA4 property? This blog answers all your questions.
Jump ahead to:
What Are Explorations in Google Analytics 4?
Google describes explorations as a collection of advanced techniques that go beyond standard GA4 reports to help you uncover deeper insights about your users’ behavior on your website and app. Explorations allow you to create audience segments, analyze user behavior, track conversion paths, and make data-driven decisions to improve business outcomes.
Explorations are an important part of GA4 because they allow you to:
- create segments and audiences,
- use filters and segments to focus on relevant marketing data,
- configure and select different analytics techniques,
- perform ad-hoc queries,
- use charts and graphs to visualize your data,
- sort and take a deep dive into your GA4 data,
- Share your explorations with your teams and other users in your Google Analytics property,
- export the exploration data for use in other tools for analysis, visualization, etc.
Additional Read: New things that can be done via Google Analytics 4 – GA4
Creating Explorations in Google Analytics 4
The standard GA4 reports allow you to track key performance metrics but do not allow analysis using any complex analytical techniques. Explorations, on the other hand, allow you to access granular data and apply analytical techniques to measure your marketing and business performance.
To access explorations, click on Explore tab in the navigation menu on the left of your screen. The Explore tab allows you to access your previous explorations, create new blank ones, or access the exploration template gallery to select from pre-built templates based on usage, techniques, etc.
An exploration has three sections:
1. Canvas
Canva is a large area displayed on the right side of your screen that displays data based on the selected techniques. You can add multiple tabs to a Canvas to use various analytical techniques within a single exploration.
2. Variables
The Variables section appears on the left side of your screen and allows you to pick metrics, segments, dimensions, and timeframe for your explorations.
3. Tab Settings
Every tab in Canvas has a Tab Settings panel. It allows you to configure explorations in a tab by selecting techniques, adding options from the Variable section, and accessing more options related to analytical techniques.
To create an Exploration, follow these steps:
- Head to Explore tab and click + to create a blank exploration or pick any template.
- Select a technique that you want to use to explore data
- Next, head to the Variables panel and add relevant items to your Exploration’s Dimension and Metric sections.
- Then drag items from the Variables panel to the Tab Settings panel.
- Hover your mouse over and click to interact with your data.
- Add filters and segments to refine your exploration data further.
Additional Read: Everything to Know About GA4’s New Metrics And Dimensions
Which Techniques Are Available to Create GA4 Explorations?
Techniques are the central part of any exploration, and you can pick from any of these techniques to create various types of explorations:
1. Free Form Exploration
Free-form exploration allows you to create tables and charts to visualize data. You can arrange and compare multiple metrics side by side in a table. Besides, you can also create nested rows to group your data and refine explorations using segments and filters. For instance, if you want to know which devices are more popular among your user base, you can create a table with Device Category, Screen Resolution, Users, Revenue, Country, etc.
2. Cohort Exploration
A cohort in GA4 is a group of users with similar characteristics. And cohort exploration allows you to understand the behavior of these groups of users with common traits and how they react to changes in strategies over time. Cohort exploration includes data for users who satisfy conditions you set based on the user acquisition date, triggered event, conversions, transactions, etc.
3. Funnel Exploration
If you wonder how visitors to your website turn into customers? Or how a buyer becomes a repeat buyer? Funnel exploration will answer all such questions related to the user journey. In addition, funnel exploration helps you visualize touchpoints and steps users take to complete an action on your website.
4. Segment Overlap Exploration
Segment overlap exploration allows you to understand how different segments overlap and relate to each other. You can compare up to three user segments at a time and use complex conditions to distinguish one audience group from the other.
5. User Exploration
You can use user exploration if you want to dive deep and explore individual user activities. You can select different user groups and explore how they interact with your website and app. Whether it is analyzing a user group with a high average order value, one uses both your website and app or events where users regularly face issues, user exploration will help you with the analysis.
6. Path Exploration
Path exploration helps you analyze user journeys using a tree graph. The path exploration gives insights like popular pages users visit after reaching your home page or actions they perform. Besides, you can also develop relations between events and their impact on user actions.
7. User Lifetime Exploration
User lifetime exploration helps you analyze how users interact with your website during their lifetime. For instance, you can identify sources, mediums, and campaigns with the highest lifetime revenue. Apart from that, you can also extract user behavior insights, such as the last product purchased by users on your site or when they last interacted with your app.
Additional Read: How to Make UA Basic Reports in GA4
Difference Between GA4 Explorations & Universal Analytics’ Custom Reports
Explorations are not available in Universal Analytics (UA), but it has custom reporting features. In UA, users can create custom reports based on specific metrics and dimensions. You can also schedule your custom reports to be generated regularly. However, these reports have limited functionalities.
UA only has three parameters (category, label, action) that you can send with every event. So, you have limited data for reporting, which is insufficient for creating reports like path exploration, event funnels, etc. Besides, UA also has limited data sampling capabilities, so only a subset of data is used to create reports.
On the contrary, Google Analytics 4 has an advanced data model with machine learning capabilities at its core, allowing it to offer custom reporting through Explorations. The GA4 Explorations allow you to replicate many standard UA reports and, in some cases, even better ones using the techniques mentioned in the previous section.
Wrapping Up
Google Analytics 4 is a great analytics tool, and its new exploration reports make it more functional than its previous versions. But did you know GA4 has quota limits on API requests you can make for accessing and manipulating data? You can easily overcome this limitation with EasyInsights.
EasyInsights connects with GA4, or any analytics platform for that matter, and duplicates your data in a separate database that you can access without using GA4 API quota. It automatically updates your data daily, so you always have the latest reporting data. Visit our website today and request a demo to try EasyInsights yourself.
Bonus Read: Unlock First-Party Data for Audience Activation and Data Enrichment
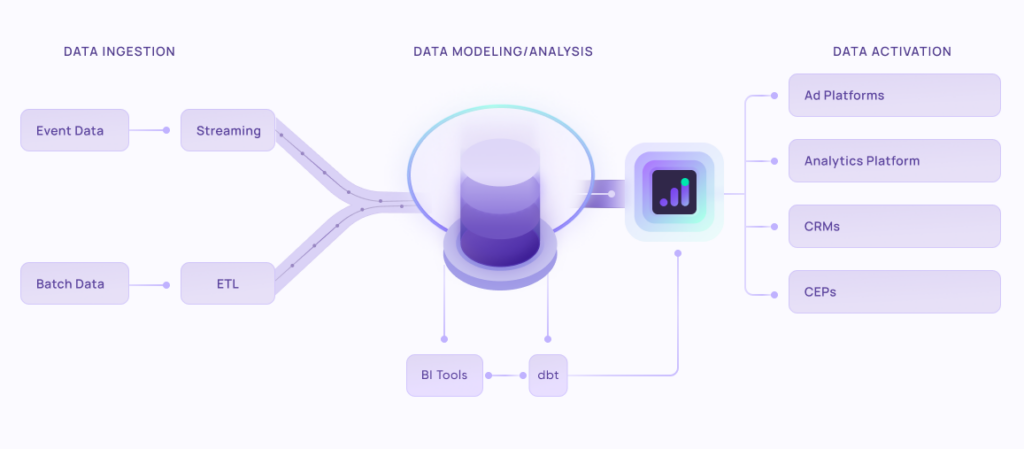
EasyInsights works with data from various platforms for data activation and data enrichment in a few key ways:
Data Collection and Transformation:
- EasyInsights connect directly to your CRMs, ad platforms, analytic platforms, CEPs and other tools allowing it to access and extract the raw data you’ve collected.
- Data Transformation: EasyInsights then cleans, normalizes, and enriches the data to make it usable for activation purposes. This may involve tasks like:
- Formatting data: Ensuring all data points are in a consistent format.
- Handling missing values: Filling in missing data points or removing them according to your preferences.
- Enriching data: Adding additional data points from other sources to create a more comprehensive picture of your customers.
Additional Reading : Composable CPDs : Some Common Misconceptions
Data Activation:
- Segmentation and Targeting: It allows you to segment your audience based on various criteria like demographics, behavior, and interests using the enriched first-party data.
- Multi-channel Marketing: You can then use these segments to activate your audience across different marketing channels like email, social media, and advertising platforms.
- Customer Relationship Management (CRM): The data can be used to personalize outreach and interactions with customers within your CRM system.
- Marketing Attribution: EasyInsights can help you understand how different marketing channels contribute to conversions and optimize your marketing spend accordingly.
Key Feature:
- Offers features like customer data platform (CDP) capabilities, marketing automation, and campaign management tools.
- Focuses on reverse ETL (extracting data from your warehouse and sending it to marketing tools) and offers pre-built integrations with various marketing platforms.
EasyInsights is a marketer’s preferred tool for first party data activation.
In this age of cross-channel marketing, EasyInsights offers a comprehensive platform to collect, store, and transform all your first-party data.
EasyInsights enhances marketing campaign efficiency in a cookieless landscape with accurate ad signals. It helps brands step away from surface-level metrics and unleash the potential of first-party data to optimize marketing strategies, ensuring a superior Return on Ad Spend (ROAS). It does all this, while being a highly affordable no-code platform with an exceptional customer support apparatus.
Sign up for a demo today to see EasyInsights in action.