Are you using Google Analytics 4 to track your website’s performance and engagement? If so, you may already know that the default ‘scroll’ enhanced measurement event only registers when a visitor achieves a scroll depth of 90%. But what if you want to track more precise scroll activity, such as 25%, 50%, or 75%? In this blog, we’ll show you how to set up advanced scroll tracking in Google Tag Manager with a GA4 custom event. We’ll walk you through the necessary steps to create a scroll depth trigger, a GA4 event tag, and a custom dimension in GA4. With this advanced tracking, you can gain valuable insights into how visitors are engaging with your website’s content and identify potential issues. Let’s get started!
Jump ahead to:
Steps to create custom event in GA4
You can create custom events in GA4 without the help of Google Tag Manager, but for most custom events, you will need to create a GA4 event tag in GTM and pair it up with a proper trigger. Here are the steps involved in the process:
- Install Google Tag Manager container code on your website if you don’t have it already.
- Set up your GA4 Configuration tag within your GTM container code.
- Create a scroll depth trigger that includes the specific vertical scroll depth percentages that you want to track.
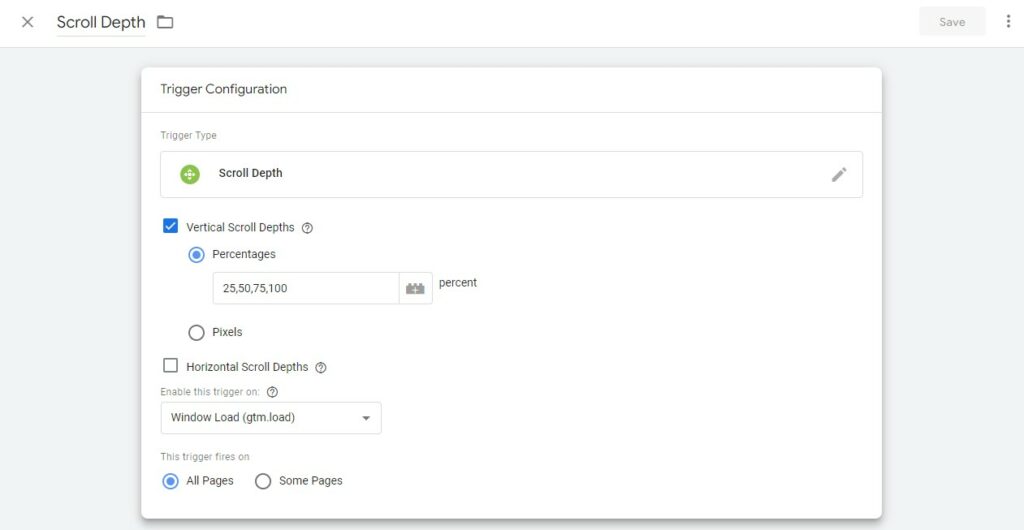
To create a scroll depth trigger, you need to select the “Scroll Depth” trigger type and specify the percentages you want to track. You can also specify whether the trigger fires on all pages or only on some pages.
- Create a GA4 event tag with the “scroll_depth” event parameter to send your scroll depth percentage information to GA4.
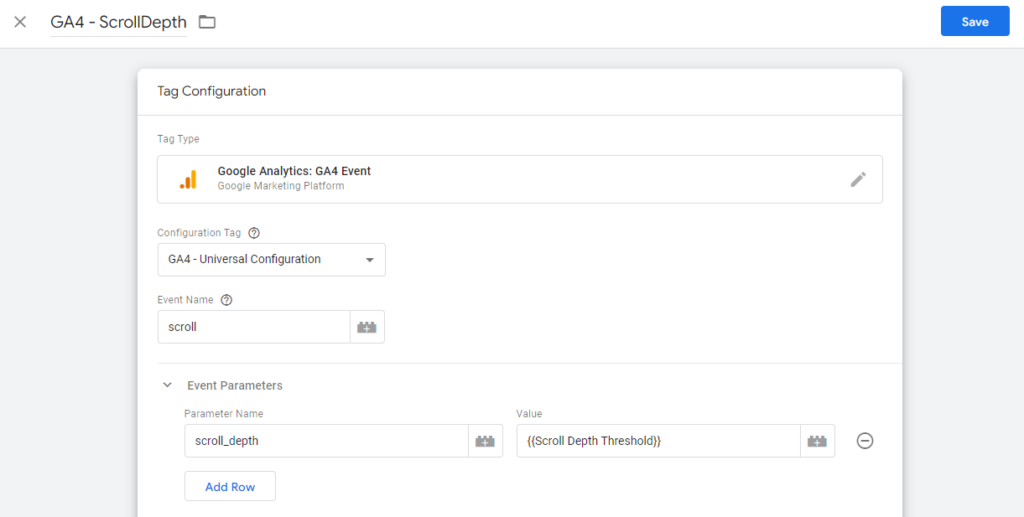
To create a GA4 event tag, select the “GA4 Event” tag type and associate it with your GA4 property. Set the event name and parameter using the variable {{Scroll Depth Threshold}} to pull in the vertical scroll depths you selected in configuring your trigger.
Note: You should include the vertical scroll depths you chose when designing your trigger, you should define an event parameter using the variable “Scroll Depth Threshold.” Remember that you have to set up your built-in variable for this if you haven’t already.
- Pair your GA4 event tag with your scroll depth trigger.
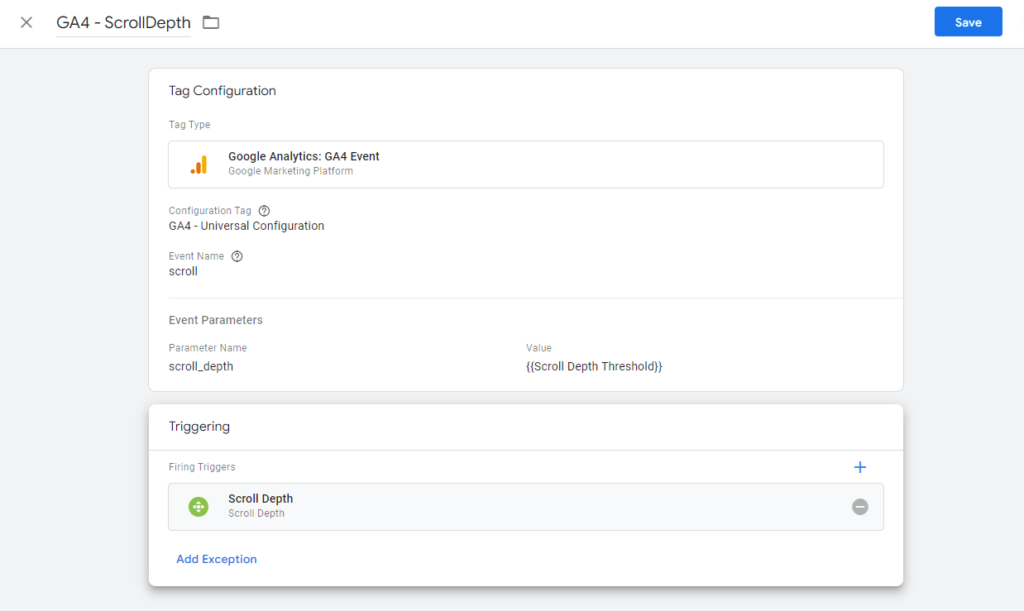
- Test to confirm everything is working as expected and publish your GTM container to make your tag and trigger live.
- Register a custom dimension in GA4 for your scroll_depth event parameter.
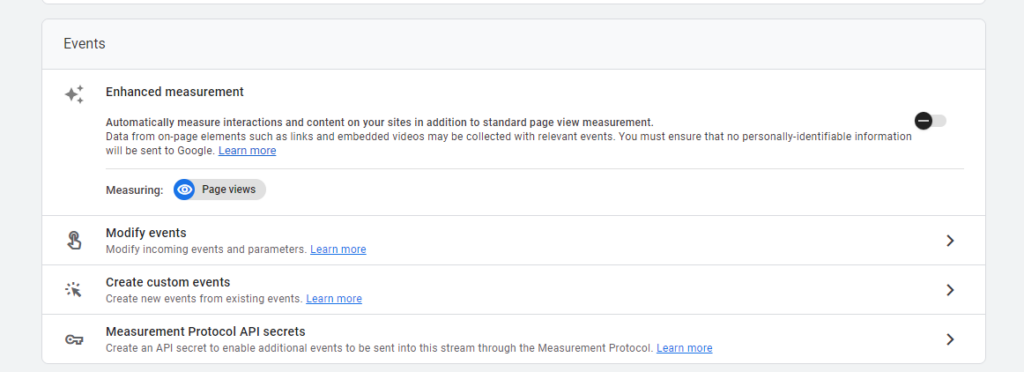
- Turn off the enhanced measurement event in the GA4 interface for scroll tracking to prevent duplication in your data.
In conclusion, Scroll tracking is a useful event that can provide you with valuable insights into your website’s user engagement and behavior. By using scroll tracking, you can identify areas where users are dropping off and optimize your content to keep them engaged. Additionally, you can use scroll tracking to test different website layouts and design elements to see what is most effective in keeping users scrolling and interacting with your site.
Data analysis plays a critical role in modern business decision-making, and utilizing the right tools can make all the difference.
How Marketers can Leverage Scroll Percentage calculated in GA4
Leveraging the tracking of scroll percentage in Google Analytics 4 (GA4) can provide valuable insights into user engagement and content consumption on your website. Here are several ways marketers can use this data:
1. Content Engagement Analysis:
- Identify Engaging Content: Analyze the scroll percentage data to identify which pages or types of content are most engaging. This helps you understand what resonates with your audience, allowing you to tailor your content strategy accordingly.
2. User Experience Optimization:
- Scroll Depth Heatmaps: Use scroll depth data to create heatmaps of user engagement. Visualizing where users tend to scroll more or drop off can highlight areas for improvement in terms of content placement, layout, and overall user experience.
3. Content Placement and Formatting:
- Optimize Content Placement: Understand how far users typically scroll on your pages. This information can guide you in optimizing the placement of important information, calls-to-action, or advertisements to maximize visibility and engagement.
4. Conversion Funnel Analysis:
- Scroll-Triggered Events: Implement scroll-triggered events to track user interactions at specific scroll depths. For example, you might trigger an event when a user reaches the middle or end of a page. Analyze these events in conjunction with other conversion events to refine your conversion funnel.
5. Time on Page Insights:
- Combining Metrics: Combine scroll percentage data with time on page metrics. This can provide a more comprehensive understanding of user behavior, helping you differentiate between users who scroll quickly through content and those who engage more deeply.
6. Segmentation and Targeting:
- User Segmentation: Segment your audience based on their scroll behavior. For instance, identify users who consistently engage with a high scroll percentage. Use this segmentation to tailor marketing campaigns, offers, or content recommendations for these highly engaged users.
7. A/B Testing:
- Test Content Variations: Implement A/B tests with different content variations and track how scroll percentage varies between the variations. This can provide insights into which content format or presentation style resonates better with your audience.
8. Mobile Optimization:
- Device-Specific Analysis: Analyze scroll percentage data based on different devices, particularly focusing on mobile devices. Optimize your content and user experience for mobile users, as they may have different scrolling behaviors compared to desktop users.
Remember to regularly review and iterate on your strategies based on the insights gained from scroll percentage tracking. Combining this data with other GA4 features and metrics can provide a more holistic view of user behavior on your website.
Introduction to EasyInsights – How EasyInsights can help you work better with Meta Ads and Google Ad Platforms
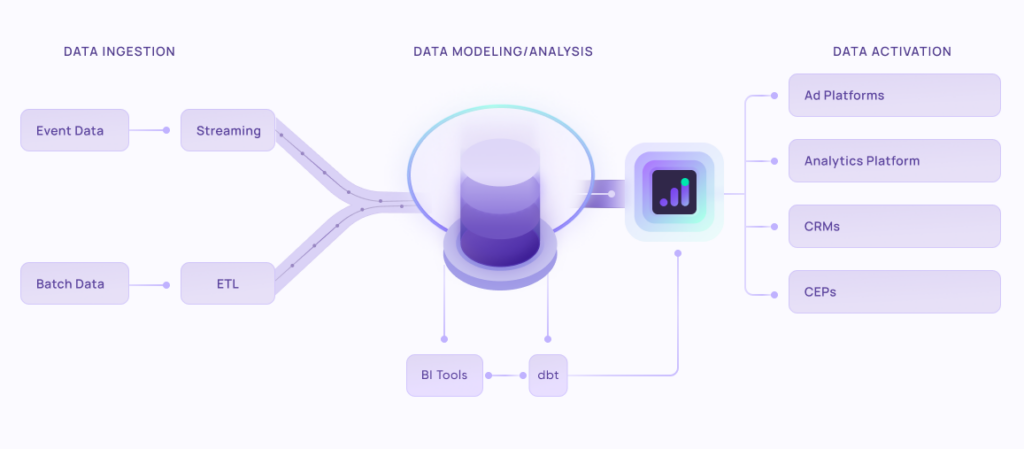
EasyInsights works with raw Meta Ads and Google Ads data for data activation and data enrichment in a few key ways:
Data Collection and Transformation:
- EasyInsights connect directly to your ad platform allowing it to access and extract the raw data you’ve collected.
- Data Transformation: EasyInsights then cleans, normalizes, and enriches the data to make it usable for activation purposes. This may involve tasks like:
- Formatting data: Ensuring all data points are in a consistent format.
- Handling missing values: Filling in missing data points or removing them according to your preferences.
- Enriching data: Adding additional data points from other sources to create a more comprehensive picture of your customers.
Data Activation:
- Segmentation and Targeting: It allows you to segment your audience based on various criteria like demographics, behavior, and interests using the enriched ad platform data.
- Multi-channel Marketing: You can then use these segments to activate your audience across different marketing channels like email, social media, and advertising platforms.
- Customer Relationship Management (CRM): The data can be used to personalize outreach and interactions with customers within your CRM system.
- Marketing Attribution: EasyInsights can help you understand how different marketing channels contribute to conversions and optimize your marketing spend accordingly.
Key Feature:
- Offers features like customer data platform (CDP) capabilities, marketing automation, and campaign management tools.
- Focuses on reverse ETL (extracting data from your warehouse and sending it to marketing tools) and offers pre-built integrations with various marketing platforms.
EasyInsights is a marketer’s preferred tool for first party data activation.
In this age of cross-channel marketing, EasyInsights offers a comprehensive platform to collect, store, and transform all your first-party data.
EasyInsights enhances marketing campaign efficiency in a cookieless landscape with accurate ad signals. It helps brands step away from surface-level metrics and unleash the potential of first-party data to optimize marketing strategies, ensuring a superior Return on Ad Spend (ROAS). It does all this, while being a highly affordable no-code platform with an exceptional customer support apparatus.
Sign up for a demo today to see EasyInsights in action.