Google Spreadsheets offer powerful analysis capabilities but at the same time, summarizing and drawing conclusions can become incredibly challenging when you have massive amounts of data.
That’s exactly where pivot tables come into the picture.
A rather game-changing feature, Pivot tables provide a faster and more flexible way of exploring your data, as compared to basic spreadsheet formulas.
In this article, we discuss the importance of pivot tables and how you can make the most of extra insights from marketing data.
Jump ahead to:
What Are Pivot Tables?
A pivot table is essentially the summary of data selections that is already present or saved in Google Sheets. You can then use these data selections as data sources in an aggregated form in order to extract the data that you want.
Pivot tables include columns, rows, data fields, and pages that can be moved around. You can also group, expand and isolate the data in real-time. Basically, pivot tables give you a bird’s eye view of large data sets and allow you to understand and organize raw data in a better way.
Normal spreadsheets have flat data which is represented by two main axes — vertical (rows) and horizontal (columns).
Shifting or ‘pivoting’ a table’s axes allow you to add a new dimension to your data which can help in extracting deeper insights.
For instance, here’s a sample dataset of paid ad campaign report
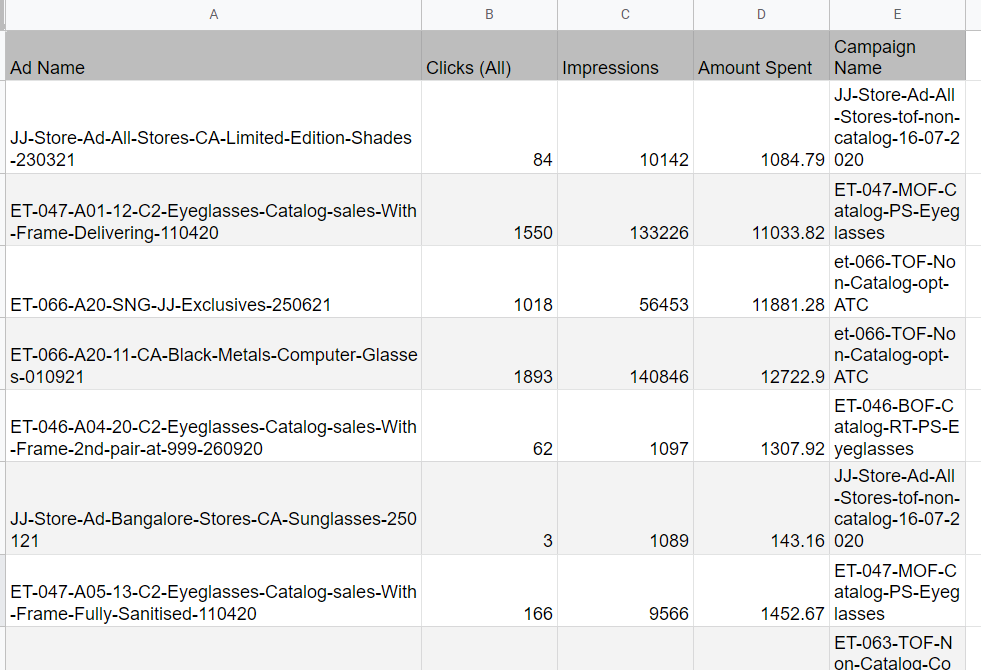
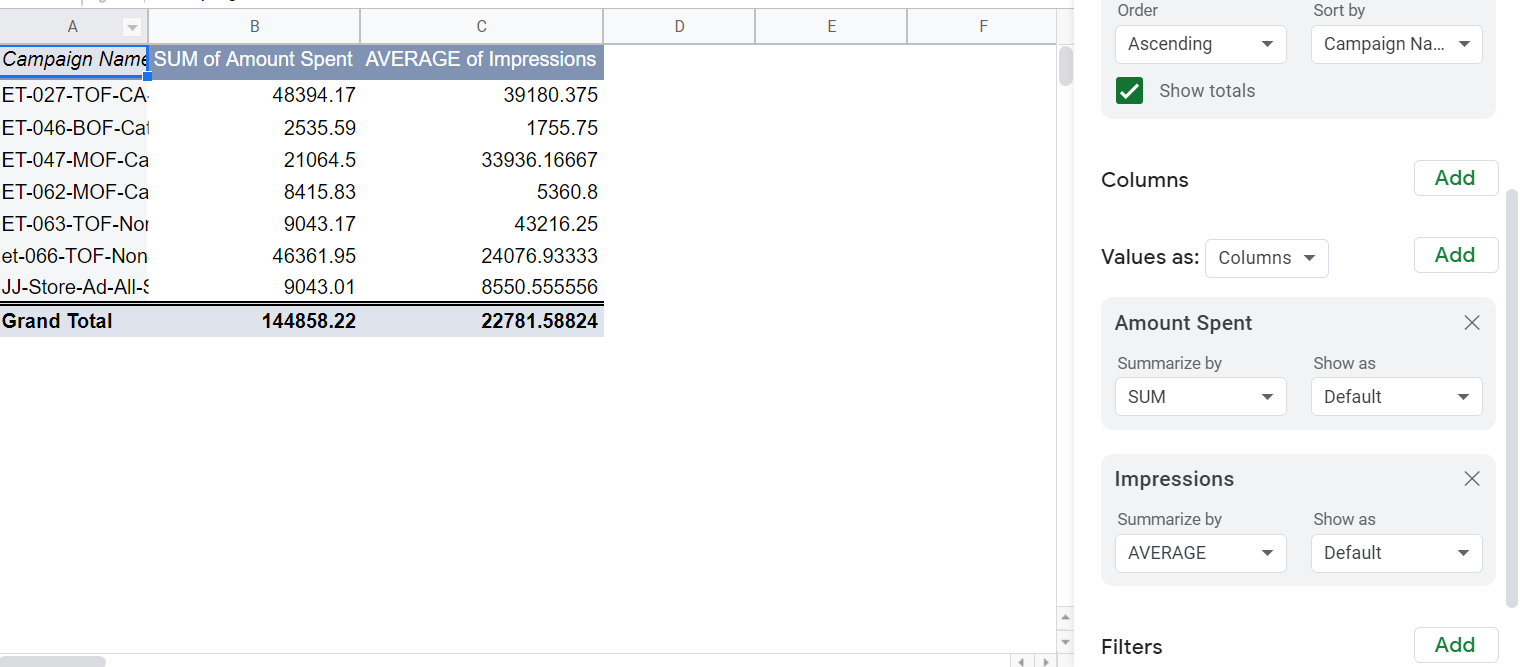
You can create a pivot table to calculate the total amount spent and the average impressions for each campaign.
Some of the many benefits of pivot tables include:
- Easy to use and highly flexible
- Allow you to sort and re-sort data in a summarized manner
- Gives the ability to perform data analysis in real-time
- Helpful in creating aggregating reports
Creating Pivot Tables in Google Sheets
There are two ways to create pivot tables in Google Sheets — Automatically through suggestions made by Google or manually.
Add a pivot table through suggestions
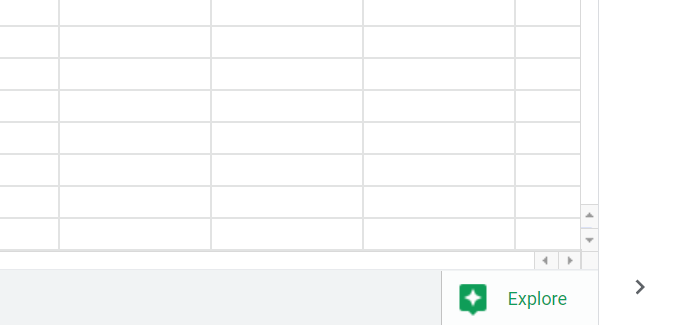
1. Open the Sheet where you want to add a pivot table and click on the Explore button on the bottom right part of the screen.
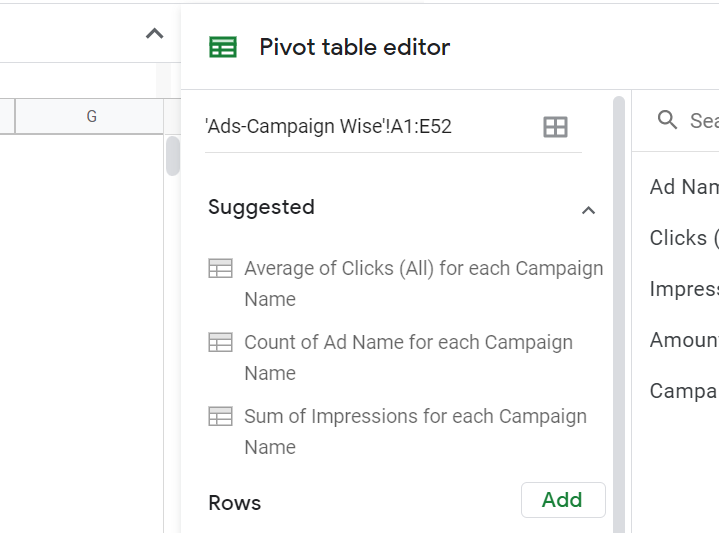
2. Scroll through the options to find the pivot table section.
3. When you find an automated pivot table suggestion that is relevant to what you are looking for, click on the ‘Insert pivot table’ button and the new pivot table will be automatically added as a new tab in your sheet.
Note: If Google does not find any relevant data that can be pivoted, no suggestions may appear. In cases like these, you can go ahead and create a manual pivot table instead
Create a manual pivot table
1. Select the columns of your marketing data set for which you want to create the pivot table while ensuring your selection includes the column headers as well
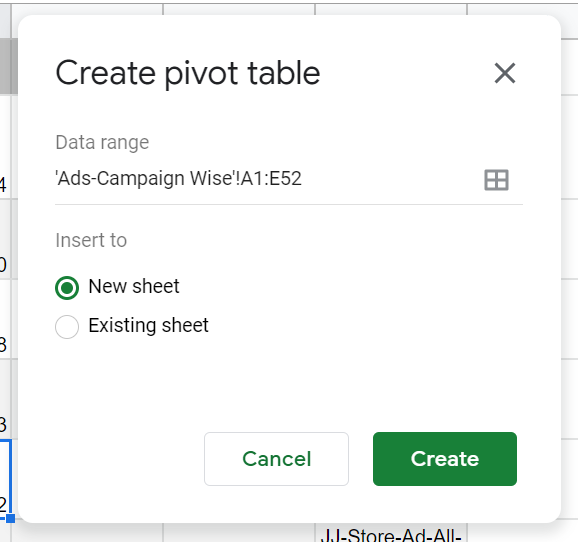
2. Go to Insert → Pivot table
3. Choose where you want to add the pivot table and click on ‘Create’
4. When your pivot table is created, go to the Pivot Table Editor tab on the right side and select the desired row, columns, volume, and filter data. You can add different types of marketing data in the rows and columns to create the report that you need.
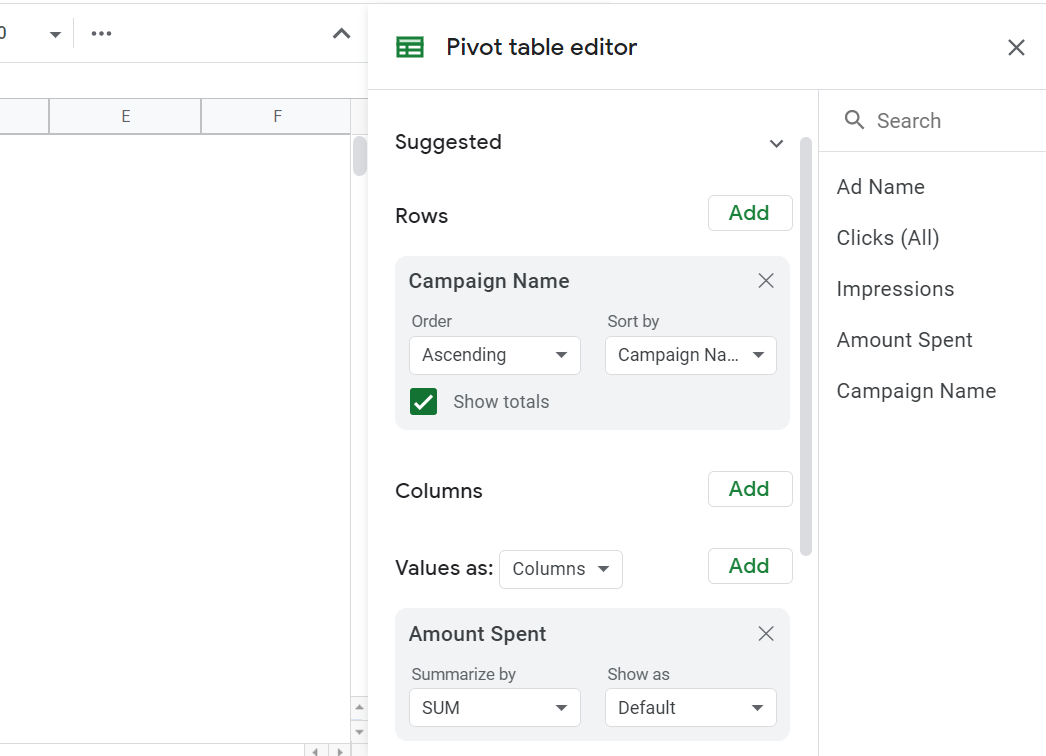
5. Click on ‘Create’ to populate your pivot table.
Need to automatically create pivot tables for your marketing and sales data?
Extracting marketing and sales data from different tools, stitching it together, and then creating accurate pivot tables in order to analyze data can be extremely time-consuming and also introduce a bigger room for errors.
Instead, you can use an end-to-end marketing data platform like EasyInsights to connect data from different sources like Google Adwords, Google Analytics, and Facebook Ads to import it into Google Sheets and get access to full-funnel stitched reports.
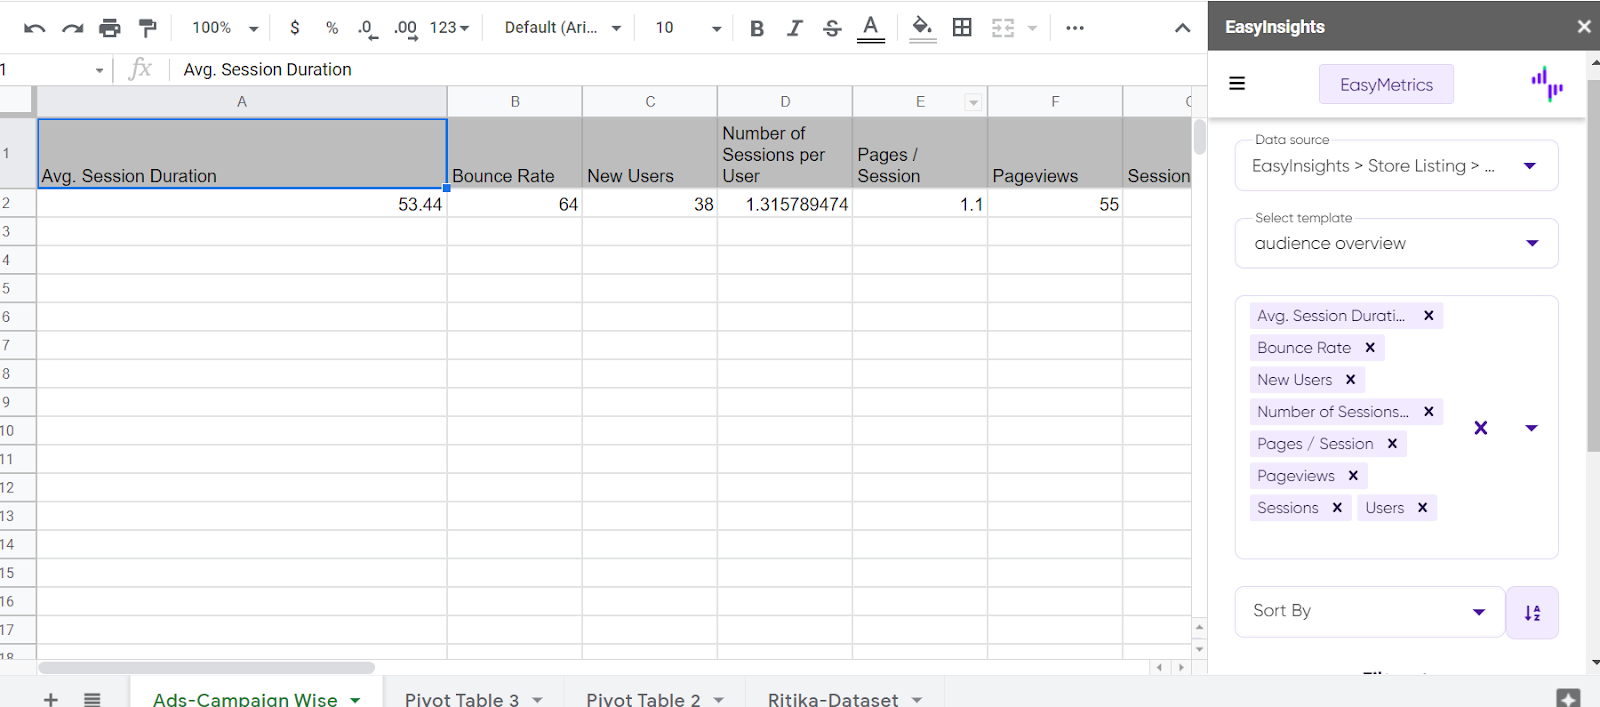
With its ability to access important data from numerous analytics and CRM tools, the AI-based platform provides you with a single and unified view of your company’s cross marketing performance.
Ready to take EasyInsights on a test spin? Book a demo and talk to our product expert to know more.