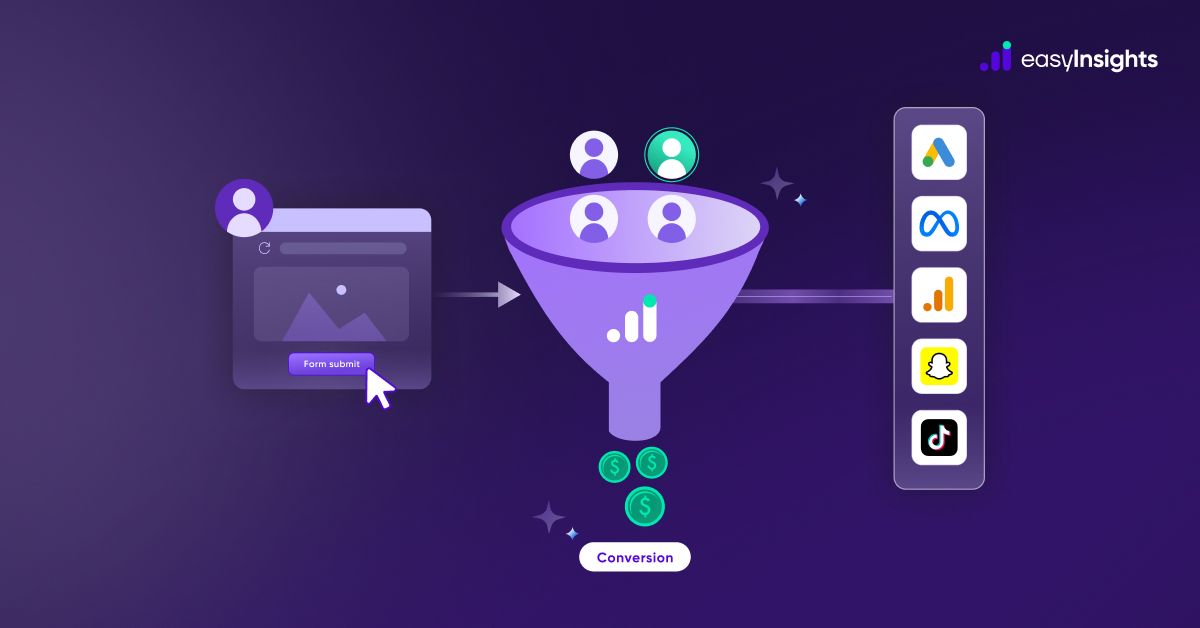
The average buyer runs several searches and views multiple ads before actually purchasing a product online. Does it make sense to attribute credit for conversion to the last ad a user views before turning into a customer? Common sense dictates that is not the case. Of course, the sum of all ads audiences view push them further into the conversion funnel.
That is why Google Analytics 4 uses attribution models to distribute conversion credit to each touchpoint customers interact with. However, Google Analytics has multiple attributions that use different rules to assign conversion credit. As a marketer, it is necessary to understand which model is ideal for your marketing campaigns. It also helps you make better use of Google Analytics 4 for your website.
In this blog, we cover attribution models available in Google Analytics 4, how to access attribution model comparison reports, and how to measure and compare campaign performance using different attribution models.
Jump ahead to:
Attribution Models in Google Analytics
An attribution model is a set of data-driven algorithms that allows Google Analytics to calculate and distribute conversion credit for different marketing touch-points or channels on the conversion path.
Google Analytics offers different attribution models to help marketers get cross-channel data-driven reports in no time.
Beyond personalization, first-party data empowers you to:
Make data-driven decisions: With accurate customer insights, you can optimize marketing campaigns, allocate resources effectively, and measure the true impact of your efforts.
Build customer loyalty: When you use first-party data responsibly and ethically, you build trust and demonstrate respect for your customers’ privacy. This fosters loyalty and encourages repeat business.
Future-proof your strategy: As privacy regulations evolve, relying on your own data ensures you’re not dependent on external sources that may become restricted or unavailable.
Attribution models were released on various dates (see below). As a result, you will only see a portion of the data if you choose a date range that includes a period of time prior to the “start date” for a model.
Models based on cross-channel rules: June 14, 2021
Data-driven attribution across channels: November 1, 2021
1. Cross-channel attribution model
The cross-channel attribution model uses the following rules to distribute credit:
- The data-driven cross-channel attribution model uses account data to calculate credit distribution for each touchpoint. The data-driven model is the default model, and Google recommends that marketers use it for accurate reporting.
- The last-click cross-channel attribution model gives 100% conversion credit to the last channel before conversion.
Examples (last-click cross-channel)
- Display > Social > Paid Search > Organic Search → 100% to Organic Search
- Display > Social > Paid Search > Email → 100% to Email
- Display > Social > Paid Search > Direct → 100% to Paid Search (Fall back to last non-direct click)
- The first-click cross-channel attribution model gives 100% credit to the first touchpoint on the conversion path.
- The linear cross-channel attribution model distributes credit across all touchpoints a user clicks in equal proportion.
- The position-based cross-channel attribution model gives 40% credit each to the first and last channel a user interacts with. Google Analytics distributes the remaining 20% to the touchpoints in the middle.
- The time decay cross-channel attribution model gives more credit to touchpoints closer in time when the conversion happens.
2. Ads-preferred attribution model
Ads-preferred attribution model gives 100% of the credit to the last Google Ad that a user clicks on. The Cross-channel last click attribution model is used if there are no Google Ads clicks along the path, as in Example.
- Display > Social > Paid Search > Organic Search → 100% to Paid Search
- Display > Social > YouTube EVC > Email → 100% to YouTube
- Display > Social > Email > Direct → 100% to Email (fallback to last non-direct click)
Also Read: Everything You Need To Know About Marketing Attribution Models
Attribution Model Comparison in Google Analytics 4
Attribution model comparison is a report that helps marketers compare different attribution models. Analyzing other models is necessary for evaluating marketing channels active under various models and identifying opportunities for optimization and growth. Attribution model comparison is available under the Advertising section of Google Analytics’ navigation menu.
Pre-Requisite for Using Model Comparison In GA4
Before we move on to see how comparisons work, here are some pre-requisites for using Google Analytics 4’s model comparison:
- The first step is to set up e-commerce and goal conversion tracking for your Google Analytics property.
- Ensure Google Analytics has reporting data of at least 30 days. Having more historical data is essential for accurate and substantial for any kinds of data-analysis, including model comparison reports.
- Marketers using Google Ads must also link it with their Google Analytics property.
Using Attribution Model Comparison in Google Analytics
Here is how you can use model comparison report in Google Analytics 4:
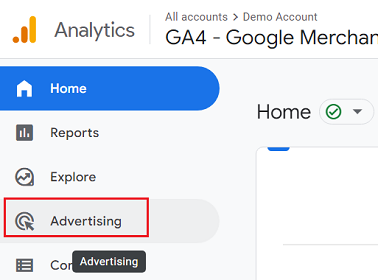
Step 1
To begin with attribution model comparison, head over to Google Analytics and click on ‘Advertising’ in the navigation menu.
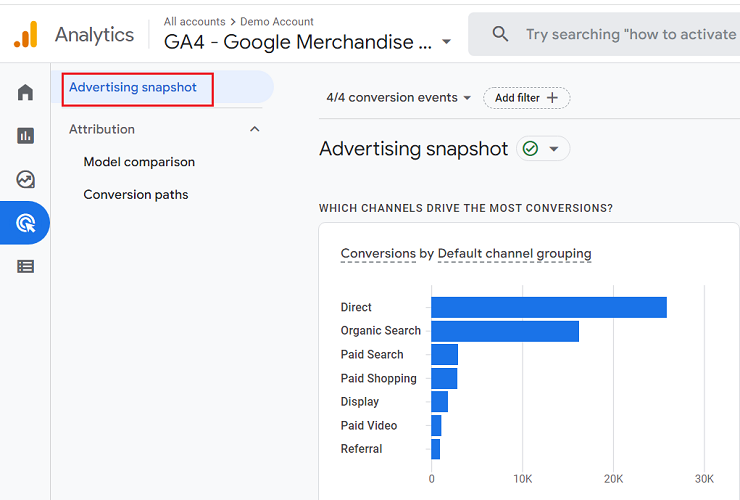
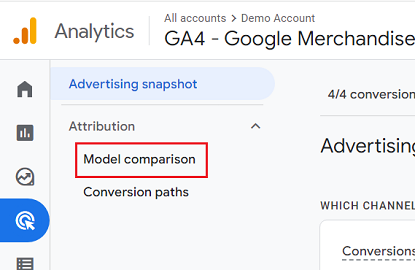
Step 2
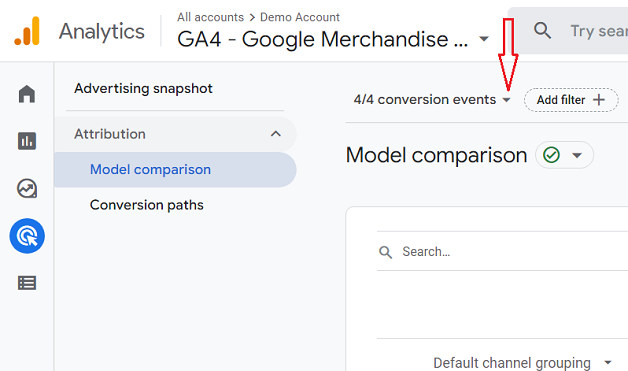
Now, you should have the ‘Advertising Snapshot’ section before you. Select ‘Model comparison.’
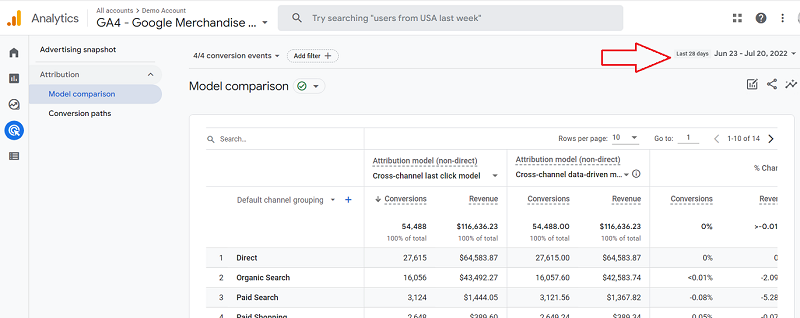
Step 3
The next step is to decide the period for model comparison. Click on the drop-down menu in the date picker option, and select the period for your analysis.
Step 4
Now, we will select conversion events for which we want to perform the model comparison. Next, click on the conversion events drop-down menu, tick the checkbox for the desired events, and hit apply.
Step 5
That’s it! Now you should have the attribution model comparison report for selected events before you. Google Analytics shows a model comparison report for all conversion events by default. But you can use the conversion event drop-down menu and tick/untick events per your needs.
Customizing Attribution Model Comparison Report in Google Analytics 4
We can also customize the attribution model comparison in GA4 for better analysis. Let us go over some of them in detail:
1. Custom Reporting Time
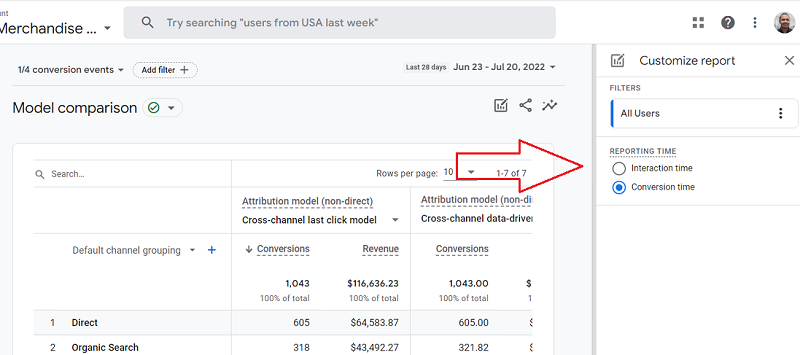
The first customization available to marketers is the reporting time. By default, Google Analytics shows the model comparison with ‘reporting time’ set to ‘conversion time.’ So, you only see touchpoints that lead to conversions in the selected period.
However, we can change reporting time to interaction time in just a few clicks. This way, we can see all the touchpoints in the selected period.
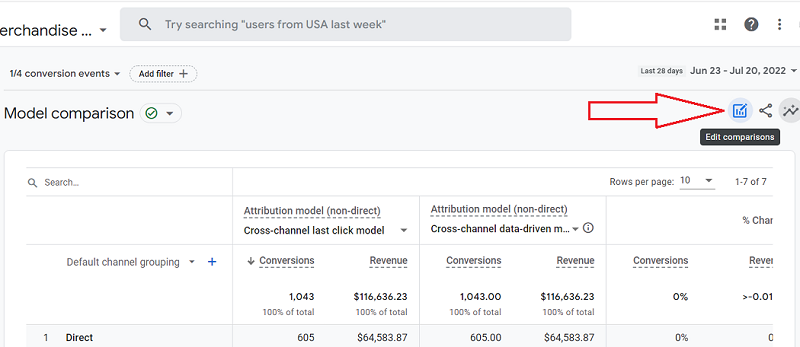
To change reporting time from conversion to interaction time, click on the ‘Edit Comparison’ button. Customize report overlays will pop up, and there will be radio buttons to select different reporting times.
2. Using Dimensions to Filter Traffic Data for Different Segments of Users
GA4, by default, shows the model comparison report for all users. However, if we were to only analyze a specific segment of users, we would need to apply some filters.
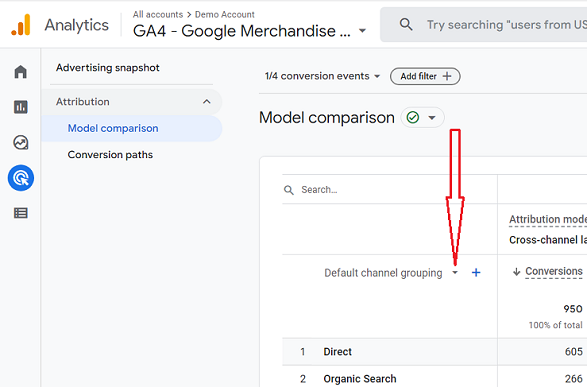
We will click the add filter button and select dimensions. We can select from primary dimensions like source, medium, and campaign.
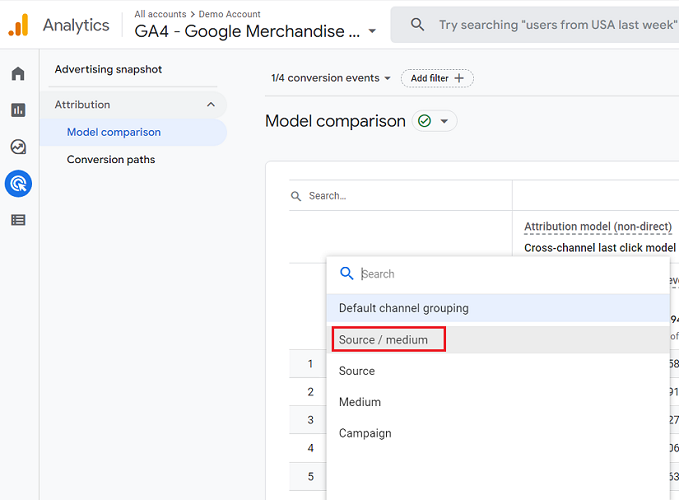
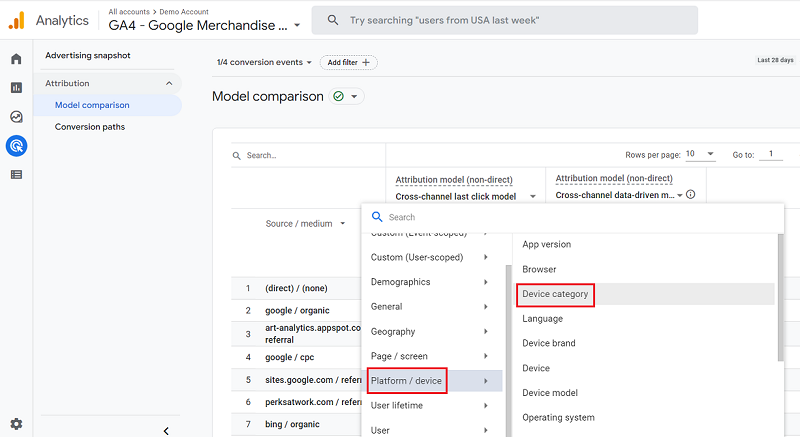
By clicking on the plus sign, we can also add secondary dimensions like demography, geography, device, user lifetime, etc.
3. Filter Traffic Data Using Search Function
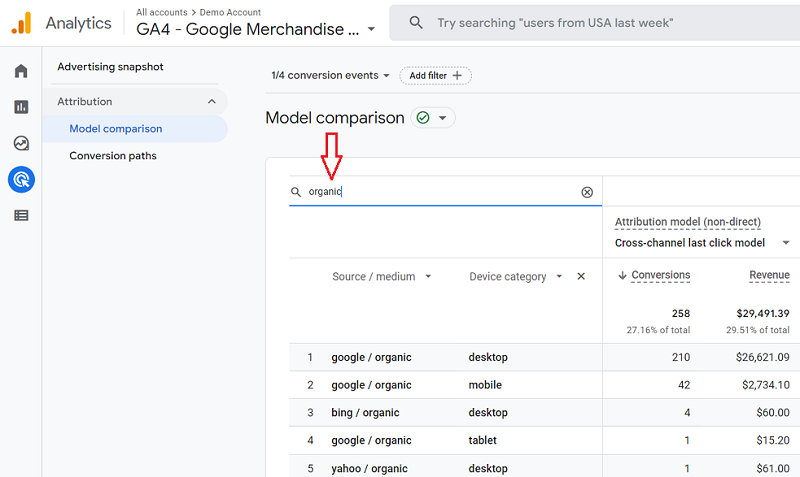
Apart from dimensions, you can also use Google Analytics 4’s search function to filter traffic data. Just enter the source name in the search bar and hit enter. So, for example, to filter out all the organic traffic, we can type “organic,” and for referrals, we can type “referral” and hit enter to filter traffic data accordingly.
Comparing Attribution Models In Google Analytics 4
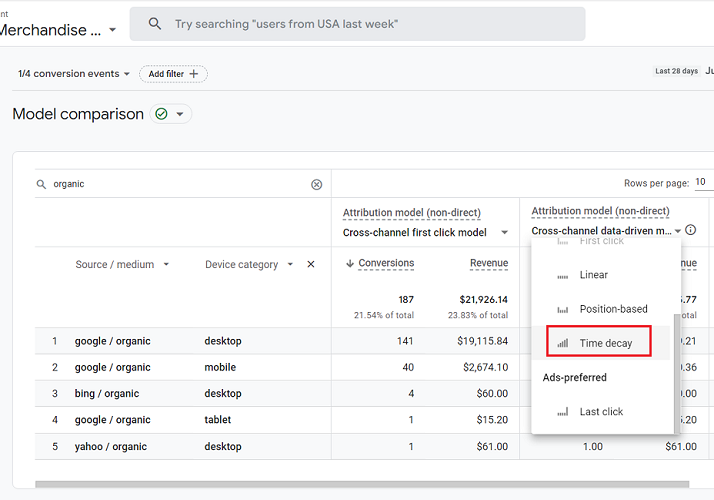
With reporting time set and traffic data filtered using dimensions per your need, you can compare conversions and revenue in different attribution models. By default, you will see model reports for the cross-channel last-click model and the cross-channel data-driven last-click model.
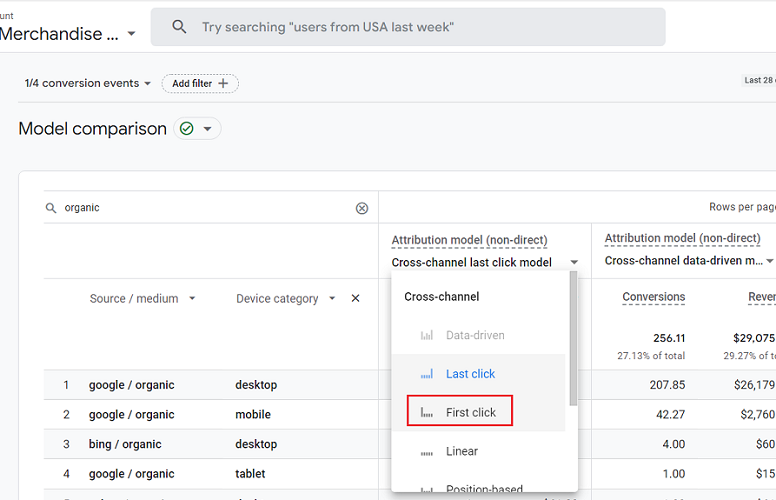
You can click on the drop-down menu and select from different rules like first click, linear, position-based, and time decay options for cross-channel models. You can also choose other models like ads-preferred and reporting attribution models.
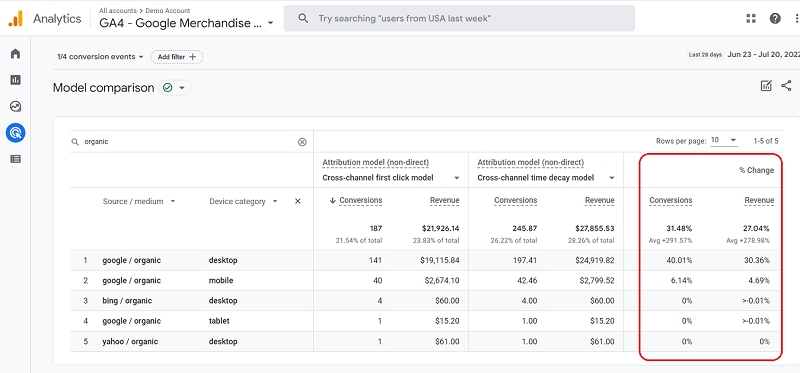
Once you have selected your desired models, click on the “<” icon to reveal the complete model comparison report. And you can see the % change in conversions and revenue for each traffic source between the two attribution models and rules you select.
Also Read: Which Attribution Model should you be using for Google Ads
To Conclude
That is all you need to know about Google Analytics 4’s attribution model comparison. This tool gives marketers an easy way to dive deep and analyze different touchpoints on the conversion path. You get to see when users make the first contact and when they actually convert. You can filter traffic based on channels, demographics, devices, and many more dimensions to get a more granular understanding of your customers’ conversion path.
How EasyInsights works with Raw GA4 Data for Data Activation and Enrichment
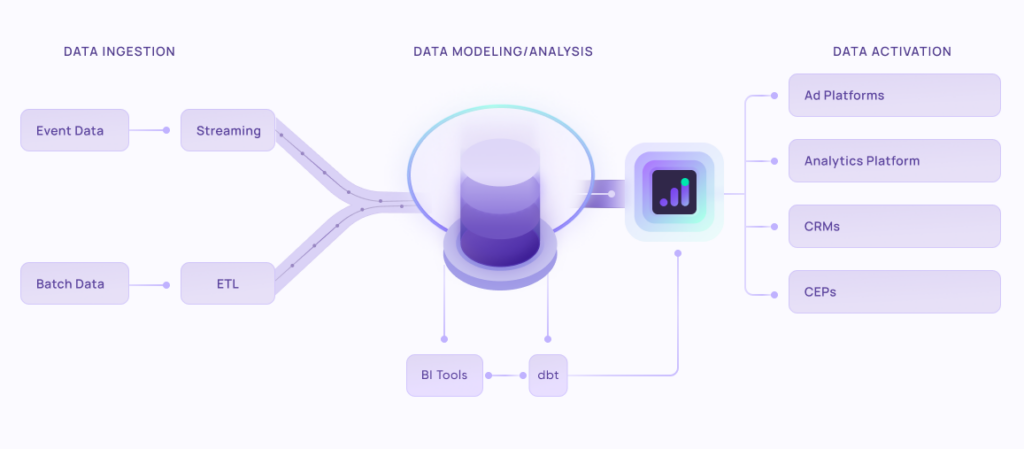
EasyInsights works with raw GA4 data for data activation and data enrichment in a few key ways:
Data Collection and Transformation:
- EasyInsights connect directly to your Google Analytics 4 property allowing it to access and extract the raw GA4 data you’ve collected.
- Data Transformation: EasyInsights then cleans, normalizes, and enriches the data to make it usable for activation purposes. This may involve tasks like:
- Formatting data: Ensuring all data points are in a consistent format.
- Handling missing values: Filling in missing data points or removing them according to your preferences.
- Enriching data: Adding additional data points from other sources to create a more comprehensive picture of your customers.
Data Activation:
- Segmentation and Targeting: It allows you to segment your audience based on various criteria like demographics, behavior, and interests using the enriched GA4 data.
- Multi-channel Marketing: You can then use these segments to activate your audience across different marketing channels like email, social media, and advertising platforms.
- Customer Relationship Management (CRM): The data can be used to personalize outreach and interactions with customers within your CRM system.
- Marketing Attribution: EasyInsights can help you understand how different marketing channels contribute to conversions and optimize your marketing spend accordingly.
Key Feature:
- Offers features like customer data platform (CDP) capabilities, marketing automation, and campaign management tools.
- Focuses on reverse ETL (extracting data from your warehouse and sending it to marketing tools) and offers pre-built integrations with various marketing platforms.
EasyInsights is a marketer’s preferred tool for first party data activation.
In this age of cross-channel marketing, EasyInsights offers a comprehensive platform to collect, store, and transform all your first-party data.
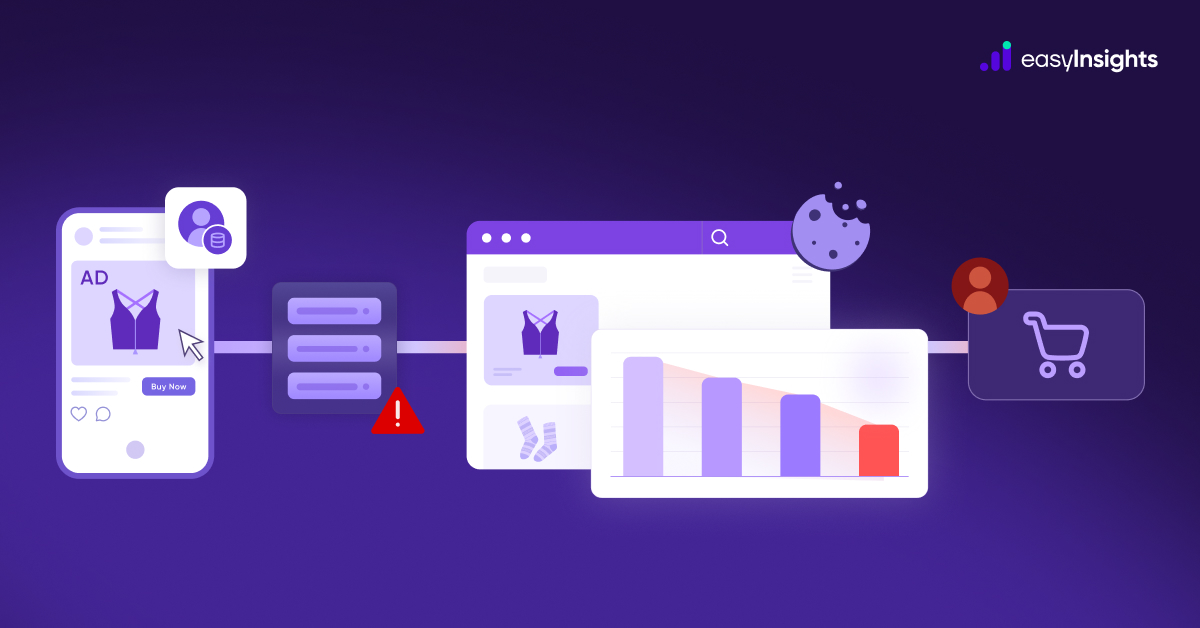
EasyInsights enhances marketing campaign efficiency in a cookieless landscape with accurate ad signals. It helps brands step away from surface-level metrics and unleash the potential of first-party data to optimize marketing strategies, ensuring a superior Return on Ad Spend (ROAS). It does all this, while being a highly affordable no-code platform with an exceptional customer support apparatus.
Sign up for a demo today to see EasyInsights in action.