Jump ahead to:
What is Brand Affinity?
Brand affinity refers to the emotional connection and positive association that consumers have with a particular brand. It represents the degree of loyalty, trust, and attachment that individuals feel towards a brand, leading to repeat purchases and advocacy.
Brand affinity is built through various means, including consistent brand messaging, high-quality products or services, exceptional customer experiences, and aligning with the values, beliefs, and lifestyle of the target audience. When consumers have a strong affinity for a brand, they are more likely to choose that brand over competitors, even if the alternatives are similar or cheaper.
Brand affinity is a valuable asset for businesses as it can lead to increased customer retention, higher customer lifetime value, and a competitive advantage in the market. It is also an important metric for measuring brand equity and assessing the success of branding and marketing strategies.
Additional Reading – How to Reduce CAC to Improve LTV:CAC Ratio?
Why is Measuring Brand Affinity Important?
There are many reasons why it is important to measure brand affinity. Here are a few:
- To track your brand’s performance over time –. Brand affinity is a leading indicator of future sales and revenue. By tracking your brand affinity over time, you can see how your marketing and branding efforts are impacting customer perception.
- To identify areas for improvement – If your brand affinity is low, it can help you identify the areas where you need to improve your brand. This could include your product or service offering, your marketing messages, or your customer service.
- To make better marketing decisions – When you know how customers feel about your brand, you can make better marketing decisions. For example, you can target your marketing messages to the people who are most likely to be interested in your brand, or you can develop new products or services that appeal to your target audience.
- To build a strong brand – A strong brand is one that is well-known, liked, and trusted by customers. By measuring your brand affinity, you can track your progress towards building a strong brand.
Measuring brand affinity is an important part of any successful marketing strategy. By tracking your brand affinity over time, you can identify areas for improvement and make better marketing decisions. This will help you build a strong brand that will attract and retain customers for years to come.
Different Ways to Measure Brand Affinity
There are a number of ways to measure brand affinity. Some common methods include:
- Surveys – Surveys are a good way to get direct feedback from customers about their feelings towards your brand.
- Digital Monitoring – It includes how people are finding, interacting with and responding to your brand. It includes approaches that monitor your content marketing and web/app analytics to get a sense of their overall sentiment.
- Customer reviews – Customer reviews can provide valuable insights into how customers feel about your brand.
In this blog, we will be deep diving into ways we can monitor brand affinity digitally.
A Comprehensive Strategy that Benchmarks Brand Affinity
1. Time spent with Brand Content
Marketers recognize (and acknowledge) the profound impact of engaging content on their audiences. Whether it takes the form of captivating videos, compelling audio, informative text, or a harmonious blend of all three, the audience’s genuine interest fuels their desire to consume even more.
Here’s the key: the greater the investment of their time and energy in consuming such content, the deeper their bond with the brand becomes. Thus, quantifying brand affinity becomes as straightforward as measuring “time spent,” the simplest and most effective Key Performance Indicator (KPI) in a marketer’s arsenal.
2. The Brand Search Volume
Brand Search Volume—the epitome of Brand Affinity or “brand interest.” This value can be used to quantify the number of individuals willingly navigating to your website, driven by a variety of motives. A flourishing brand is bound to witness a steady surge in this figure. The art of effective Brand Affinity Marketing consistently elevates Brand Search Volume over an extended duration.
3. Increase in the Number of Subscribers
An increase in the number of subscribers can signify a rise in brand affinity. When individuals choose to become subscribers, they make a conscious decision to stay connected with a brand, showing an increase in the level of interest in the brand.
Subscribing indicates a deeper commitment beyond mere casual consumption of content. It signifies that individuals value the brand’s offerings, trust its expertise, and desire to receive regular updates and exclusive information. Therefore, an upward trend in subscriber count is a strong indicator of growing brand affinity as more individuals actively choose to establish an ongoing relationship with the brand.
4. Increase in the Number of Engaged, Regular Users
The number of engaged users can be a clear reflection of increase in brand affinity. Engaged users go beyond passive observers and actively interact with a brand’s content, signalling a genuine connection and interest. They participate in discussions, share feedback, contribute to online communities, and may even promote the brand through word-of-mouth. By actively engaging with the brand, they become brand advocates (or “fans”) and influencers within their networks.
Therefore, when the number of engaged users rises, it indicates an expanding community of invested individuals who not only consume the brand’s content but also actively endorse and support it. This increase in engaged users is a compelling measure of growing brand affinity.
5. Tracking Content Consumed Per User
There is a distinct advantage in capturing email addresses through subscriber acquisition. It opens up a world of possibilities, including the ability to identify and monitor individuals who consistently return to your content.
This allows us to leverage the principles of marketing automation to implement a unique approach called “fan scoring”. Unlike traditional lead scoring, fan scoring focuses on cultivating (and evaluating) your fan base.
6. A Positive Digital Social Footprint
Positive indicators like content shares, recommendations, and affirmations demonstrate a strong brand affinity, showcasing the positive sentiment people have towards your brand. Conversely, passing mentions, complaints, or general conversations may indicate brand awareness without necessarily conveying a positive sentiment.
Tools and Metrics that Compliment your Strategy for Reporting on Brand Affinity
Now that we have a basic understanding of the rationale based on which brand affinity benchmarking should be done, we now move on to the tools that can help us gather metrics that we can use .
1. Google Analytics for Measuring Brand Affinity
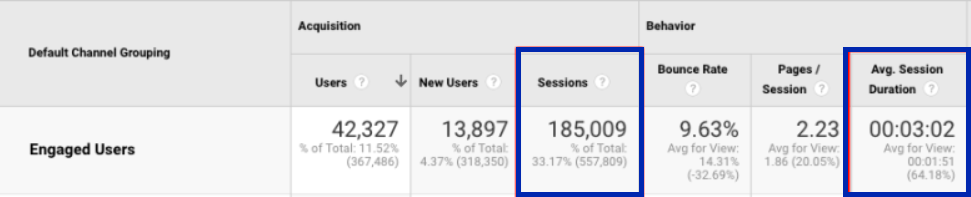
You can get an aggregated (and also raw) measure of “time spent” with your content using Google Analytics. By multiplying the number of sessions by the average session duration, you can easily derive this insightful metric. The ultimate objective is to drive marketing in such a manner so as to witness a continuous increase in the “time-spent” figure.
Additional Reading – How To Create a Comprehensive Google Analytics Report
However, to extract meaningful insights from this data, it has to be cleaned. For example, it’s vital to exclude trivial or transactional interactions, focusing solely on data from users who can genuinely be considered as “fans” of your brand. Another example is the initiation of a PPC campaign. While a new PPC campaign may drive a surge in traffic, thereby boosting the time-spent metric, it’s essential to evaluate if these users exhibit regular visits and meaningful engagement. After all, brand affinity is not solely built on one-off interactions.
To streamline this process, my recommendation is to employ the “Engaged Regular Users” custom segment. This segment effectively filters the data, allowing you to concentrate solely on users who have visited your website three or more times, spending at least a minute during each visit. By using this custom segment, you can accurately gauge the impact of loyal users who actively return to your content, providing a more comprehensive understanding of brand affinity.
By integrating GA with your CRM, you can create a comprehensive fan scoring mechanism. You can establish triggers and qualifiers that contribute to the fan score of each user. Key triggers to consider include milestones such as reaching the end of a blog post or watching 90% of a video. These triggers enable you to precisely track the amount of content consumed by each user, assign an engagement level, and gain insights into their content preferences and patterns.
Furthermore, this data empowers you to create distinct user groups and bestow “fan” status based on specific behavioral indicators. For example, by identifying individuals who have consumed a significant amount of content and display high engagement, you can designate them as highly engaged fans. This allows you to establish benchmarks for their content consumption over time, with the aim of observing stable or, ideally, increased engagement levels.
Through this comprehensive fan scoring system, you can elevate your brand affinity tracking, gain valuable insights into user behaviors and tailor your strategies to cultivate and nurture a passionate fan base.
2. Facebook Video Content Insights for Measuring Brand Affinity
I understand the importance of utilizing Facebook Insights to gain valuable data on video performance. However, it’s crucial to approach the provided metrics with caution, as they may not offer an accurate depiction of user engagement. Allow me to elaborate –
Facebook Insights offers a metric called “Minutes Viewed” for your videos. This metric includes every 5–10 second impression on any video within your account. Due to the nature of Facebook’s dynamic “feed,” a substantial number of passing viewers and bots can artificially inflate these metrics, creating a false impression of engagement. It’s common to witness thousands of “hours watched” on Facebook, primarily resulting from fleeting encounters as users casually scroll through their feed. Such interactions do not reflect genuine investment of time in your brand and should be discounted.
Similar to the approach with Google Analytics, cleaning the data is imperative here. Unfortunately, Facebook doesn’t make this task easy for you.
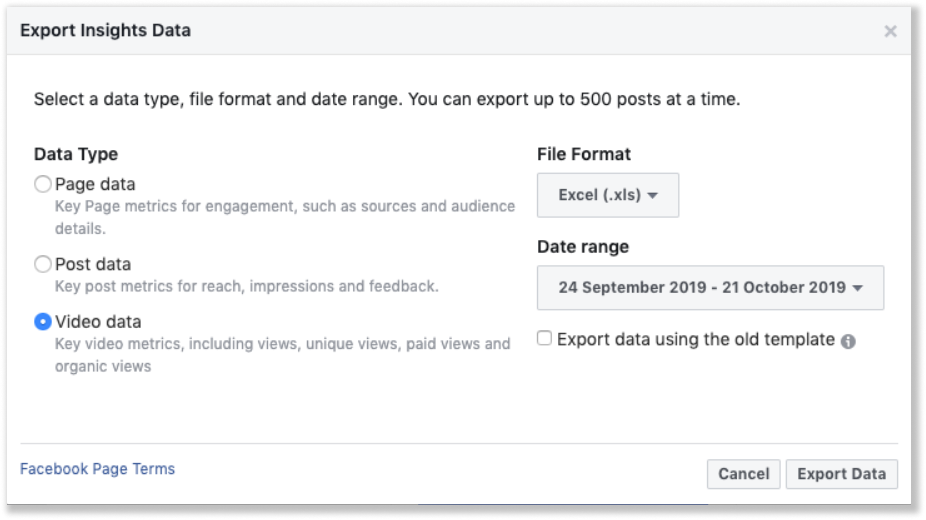
The way around is this – Export all video data from Facebook Insights. Then, delve into the granular breakdowns to identify the number of viewers who watched the video beyond a certain percentage, let’s say 95%. Now, by multiplying the figure for 95% completed views by the video duration, you can arrive at a much more realistic representation of the time spent with your content compared to the default metrics provided by Facebook.
With this approach, you can gain a clearer understanding of genuine user engagement with your videos on Facebook and make informed decisions to optimise your content strategy accordingly.
Recommended Read: How to Increase ROAS by 20% – Facebook Ads
3. YouTube Analytics for Measuring Brand Affinity
While the default “Watch Time” metric is easily accessible on the YouTube dashboard, the real info lies in the deeper segments of the platform, where you can analyze data by the traffic-source segmentation. Unfortunately, YouTube doesn’t allow discounting of trivial interactions when calculating time spent, meaning that the data will include users who briefly watched a video without significant engagement before moving on. This means that the data obtained is not necessarily clean.
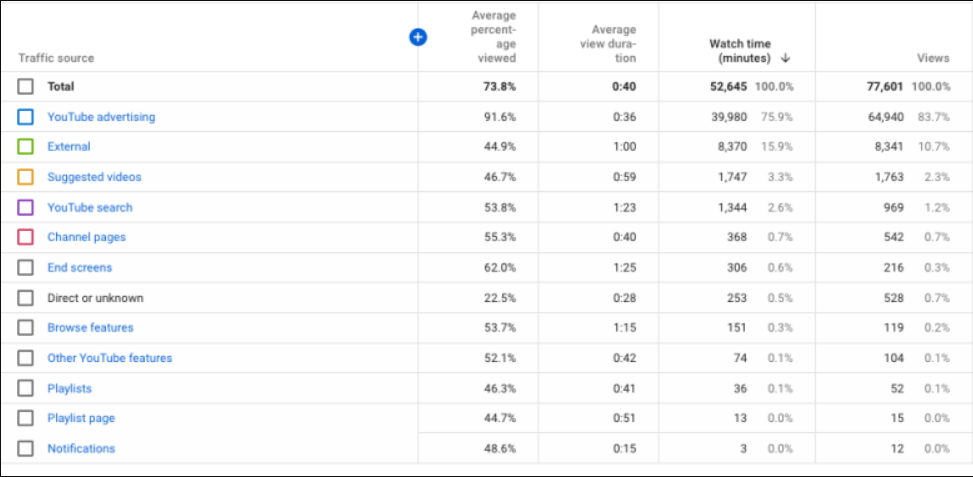
Also, make sure to exclude data from YouTube advertising since genuine brand affinity is built on voluntary engagements rather than forced views. By removing advertising-related data, you can establish a benchmark that represents voluntary engagements. Combine this information with insights from Google Analytics, Facebook Insights, and other platforms to gain a comprehensive understanding of user engagement.
4. Google Search Console for Measuring Brand Affinity
Google Search Console (GSC) can help you determine brand volume search by providing you with data on how often your brand name is searched for on Google. This data is available in the Search Analytics report in GSC.
To find the brand volume search data in GSC, follow these steps:
- Go to Google Search Console and sign in to your account.
- Click on the Performance report.
- In the Queries section, you will see a list of all the queries that have resulted in impressions for your website.
- To filter the list to only show brand queries, enter your brand name in the Search query field.
- The Search volume column will show you how many times your brand name was searched for in the past month.
The brand volume search data in GSC can be a valuable tool for measuring the awareness of your brand. By tracking how often your brand name is searched for, you can see how your marketing and branding efforts are impacting customer perception.
5. Mention/ Brandwatch for Measuring Brand’s Social Footprint
There’s the option of investing in a social monitoring tool for brand marketing, such as Mention or Brandwatch. These tools enable you to track and analyse mentions of your brand, providing valuable insights into the sentiment associated with those mentions.
By utilising social monitoring tools and conducting sentiment analysis, you can get a deeper understanding of how your brand is perceived and make informed decisions to refine your marketing strategies. This allows you to nurture brand affinity and foster a positive sentiment among your audiences.
Metrics to Avoid when Measuring Brand Affinity
Here are some metrics that are not true indicators of Brand Affinity and can be excluded from reporting –
1. Likes and Shares
Social media engagement metrics like conversation (replies), amplification (shares), and applause (likes) are often used as brand marketing benchmarks. However, they don’t directly indicate brand affinity.They may show proficiency in social media usage, they don’t necessarily lead to increased liking of the brand.
Why? Because brand affinity is driven by personal values and meaningful connections, not just engagement on social media. Simply optimising for these metrics can dilute a brand’s unique voice and cater to the lowest common denominator. While these metrics have value, they shouldn’t be treated as the sole KPIs for measuring brand success. A holistic approach considering emotional resonance and genuine connections is vital for cultivating true brand affinity.
2. Impressions & Views
Views and impressions are commonly regarded as significant marketing metrics, as they seemingly represent “reach.” However, their perceived significance in brand building stems from the era of TV advertising. In the past, impressions would essentially equate to the number of individuals watching an advertisement. Yet, with the rise of ad skipping and growing ad blindness, these metrics are becoming increasingly disconnected.
It is important to emphasize that the number of impressions does not equate to the number of people genuinely impressed. When measuring brand affinity, what truly matters is the latter—how people actually perceive and connect with the brand.
EasyInsights To Aid With Monitoring Brand Affinity
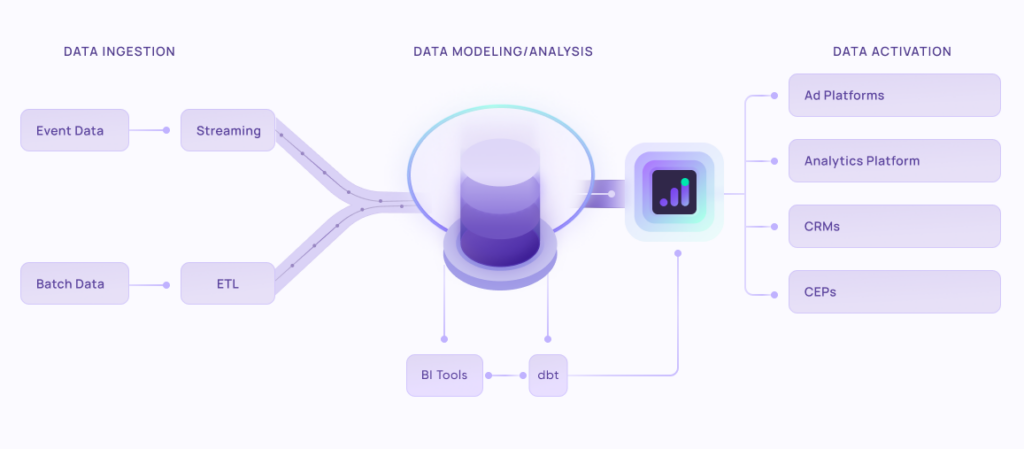
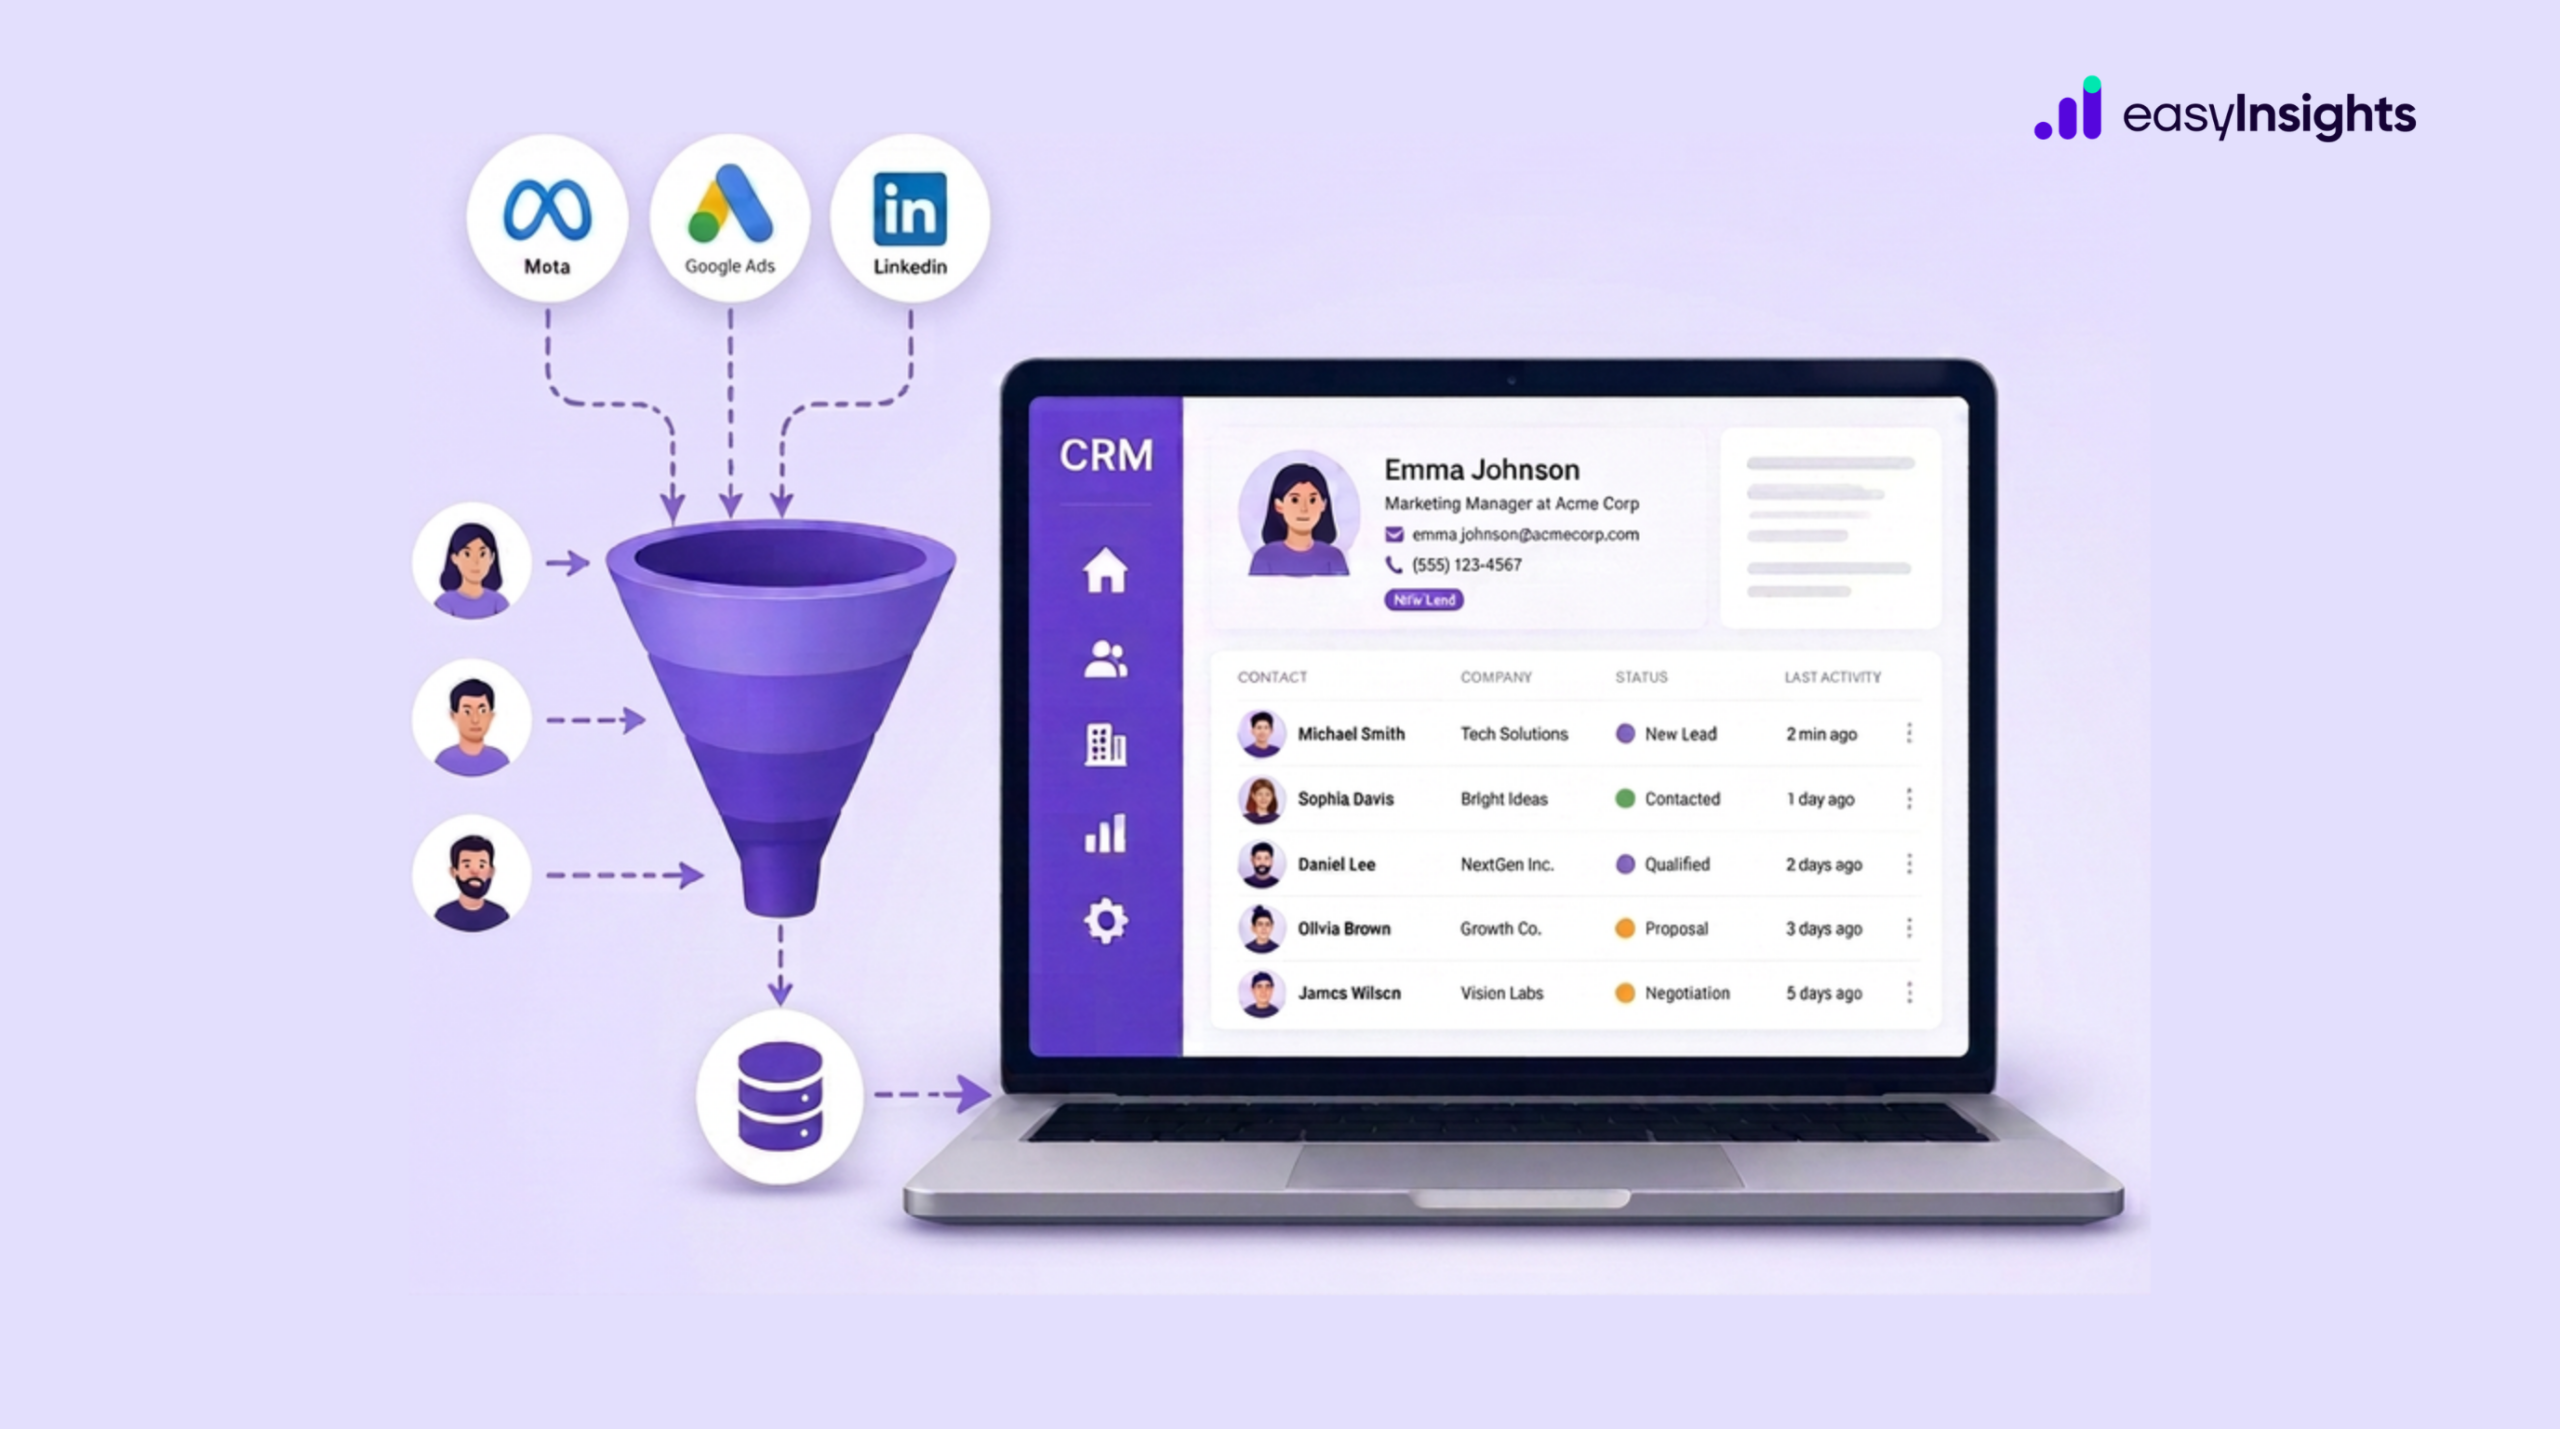
EasyInsights works with raw data from platforms like Facebook and YouTube or data activation and data enrichment in a few key ways:
Data Collection and Transformation:
- EasyInsights connect directly to your ad platform allowing it to access and extract the raw data you’ve collected.
- Data Transformation: EasyInsights then cleans, normalizes, and enriches the data to make it usable for activation purposes. This may involve tasks like:
- Formatting data: Ensuring all data points are in a consistent format.
- Handling missing values: Filling in missing data points or removing them according to your preferences.
- Enriching data: Adding additional data points from other sources to create a more comprehensive picture of your customers.
Data Activation:
- Segmentation and Targeting: It allows you to segment your audience based on various criteria like demographics, behavior, and interests using the enriched ad platform data.
- Multi-channel Marketing: You can then use these segments to activate your audience across different marketing channels like email, social media, and advertising platforms.
- Customer Relationship Management (CRM): The data can be used to personalize outreach and interactions with customers within your CRM system.
- Marketing Attribution: EasyInsights can help you understand how different marketing channels contribute to conversions and optimize your marketing spend accordingly.
Key Feature:
- Offers features like customer data platform (CDP) capabilities, marketing automation, and campaign management tools.
- Focuses on reverse ETL (extracting data from your warehouse and sending it to marketing tools) and offers pre-built integrations with various marketing platforms.
EasyInsights is a marketer’s preferred tool for first party data activation.
In this age of cross-channel marketing, EasyInsights offers a comprehensive platform to collect, store, and transform all your first-party data.
EasyInsights enhances marketing campaign efficiency in a cookieless landscape with accurate ad signals. It helps brands step away from surface-level metrics and unleash the potential of first-party data to optimize marketing strategies, ensuring a superior Return on Ad Spend (ROAS). It does all this, while being a highly affordable no-code platform with an exceptional customer support apparatus.
Sign up for a demo today to see EasyInsights in action.