Google Analytics 4 (GA4) is transforming the way marketers make decisions. With an impressive 8.4 million websites leveraging UA’s successor as of March 2023, there’s no denying that GA4 is making waves. And among the analytic platform’s many revamps is its exploration capabilities. By going beyond the standard GA4 reports, these advanced techniques allow you to take the magnifying glass closer to how your website is performing. One in particular is the user explorer technique.
While user exploration isn’t something new, it has improved vastly in GA4. And here, we discuss all you need to know about the user explorer report in GA4.
Jump ahead to:
User Explorer in GA4
GA4’s user explorer report allows marketers to gain insight into specific user groups interacting with their websites. By offering detailed data on each user’s activities, it allows you to extract all necessary insights to personalize user experience, understand specific user flow, and even identify any bottlenecks or issues arising in your user experience.
For instance, if you have a high cart abandonment rate, you could leverage user explorer exploration to zero in on what’s prompting users to drop their purchases.
User explorer report facilitates targeted user information such as,
- User details such as country, time, date of visit, etc.
- List of user events, such as user_engagement, user_views, click, session_start, etc.
- Revenue generated by a user to date and, by extension, their loyalty to your platform
- Time spent by the user on your website or app
- The number of conversions and other event
By gaining insight into such user data, marketers can understand the ground reality, equipping them better when making informed decisions. After all, if you know your customer and their likes/dislikes, your marketing campaigns are bound to yield the results you seek.
Additional Read: A Complete Guide to Explorations in GA4
The Best Way for Marketers to Leverage User Explorer Reports in GA4
User explorer reports empower you to better understand your users by offering a detailed run-down of their preferences, behaviors, etc. And this, in turn, can help you make better decisions that are data-backed and yield improved results.
As marketers, there’s nothing better than being able to map user behavior and understand how you can connect with them better.
Here’s how user explorer reports can help you in your marketing campaigns.
1. Examine Specific User Behavior
User explorer report allows you to analyze the user behavior of a particular segment of users. By this, we mean you can get a more detailed view of the activities of a specific subset of your audience.
For instance, let’s say the Audience Overview Report informs you that users from Canada have the lowest average session duration among all your segments. To find out what’s prompting this behavior, you can apply this segment to user explorer and examine what’s going on.
Are your Canadian users bouncing off the same page, or are there a series of pages to be blamed? You learn this from your user explorer report.
It could be that the pages with the highest bounce rate aren’t conducive to the Canadian audience- content might be irrelevant, the visuals unoptimized, and the like. To get to this point, you need a user explorer report.
2. Retarget Users
User explorer exploration also allows you to examine individual users and what’s keeping them from completing purchases. Taking the example from earlier, you might notice that users are adding products to their cart but not reaching the payment stage.
In such cases, you can retarget them with personalized ads featuring the products in their cart. Another scenario is that users did purchase a product but viewed it and didn’t buy something complementary to the purchased product. It could be a matching bracelet to a pair of earrings or pillow covers to a bedcover.
Gaining this information from user explorer reports can help you retarget them with ads featuring these products. All you have to do is apply segments based on user behavior in the report and then leverage those segments for remarketing efforts.
3. Develop Specific Personas
Ideal customer profiles (ICP) are a guiding light for marketers. It helps them gauge how their audience will react to marketing initiatives, where to target them best, and how.
Examining the different user segments in your user explorer report takes it a step further by allowing you to identify personas based on user activity.
For instance, you can create segments of female users between the age of 20-30 that belong to different interest categories. This could be avid readers, fitness enthusiasts, keen investors, and the like.
Now, applying the segments to the report, you can analyze user activity to zero in on products that users view, purchase, and ignore. This can help make improved marketing decisions as well as offer valuable product improvement recommendations.
4. Personalize Customer Journey
According to a McKinsey & Company report, 71% of consumers expect personalization, while 76% are frustrated if they don’t find it. Personalization is key in today’s marketing, where customers have no shortage of options. For your products and services to stand out, you need to customize your buyer journey.
And your user explorer report can help with that. How? By showing you a detailed journey for each user. For instance, your user explorer report can inform you when a particular user last purchased a product, help you personalize recommendations, and retarget them again if there’s been a considerable time lapse.
Steps to Create a User Explorer Report
You can create a user explorer report in just a few easy steps. To start, log into your GA account and follow the steps below.
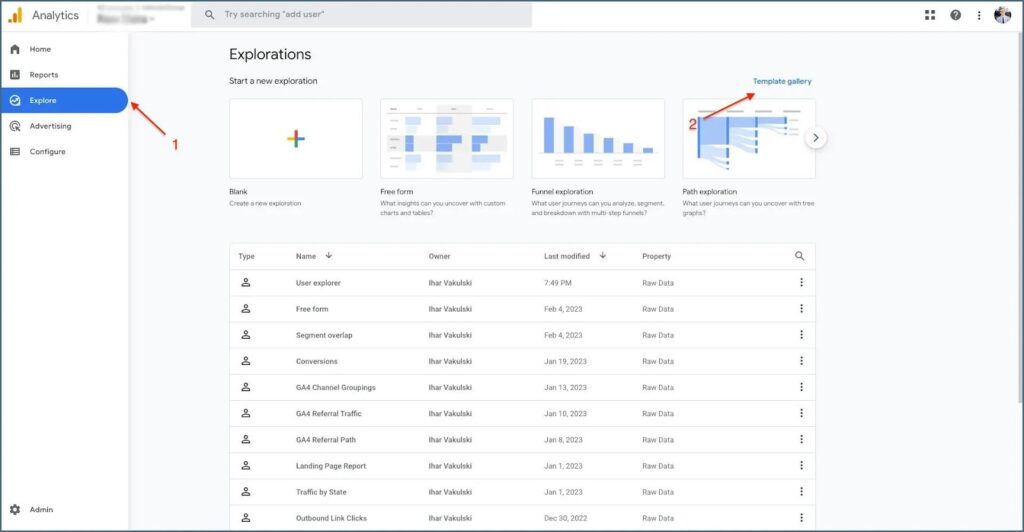
Step 1: Click on Explore from the navigation menu on the left. After this, click the Template gallery.
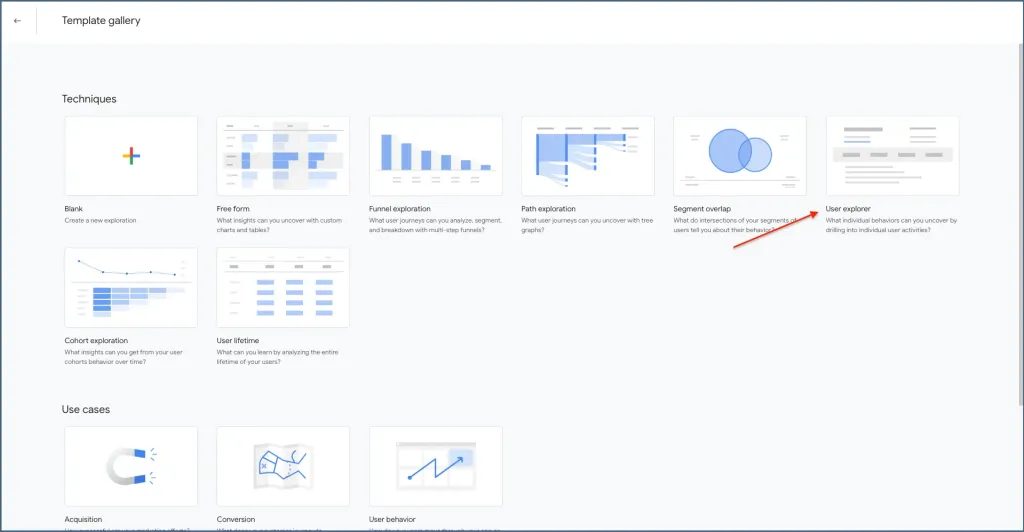
Step 2: Next, click User explorer.
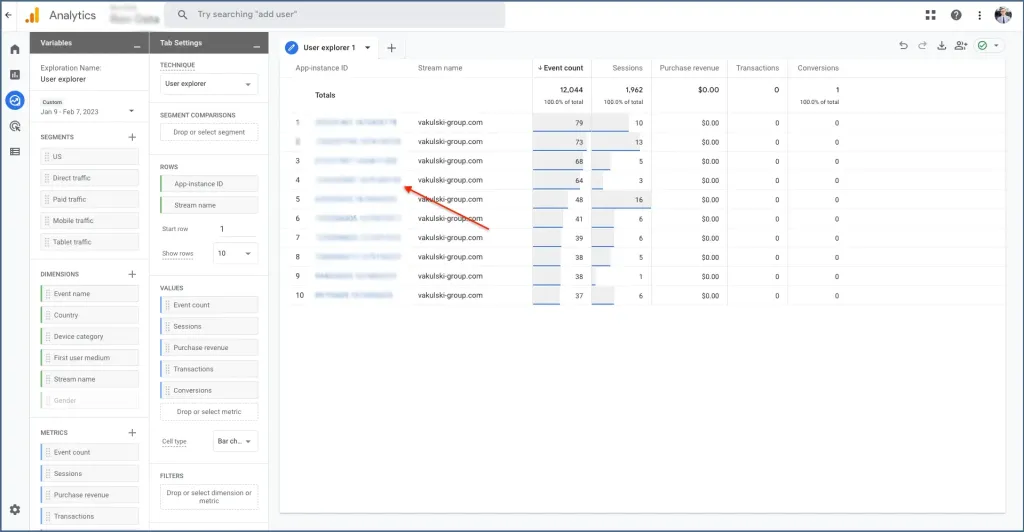
Step 3: Click App-instance ID to access individual user activity.
Step 4: Now, you can add filters and segments to select the users you want more information on.
Your data is waiting to be explored. And the best way to get the most out of your reports is to familiarize yourself with the various filters, segmentations, and settings offered by GA4 in this regard.
Additional Read: Learn to Use Standard Reports of GA4
Customizing User Explorer Report
You need targeted, focused, and detailed data on your users to make successful marketing decisions. To help you with this, GA4 user explorer reports offer an array of customizations. Here’s a look at the possible customizations you can make to sift through user data efficiently.
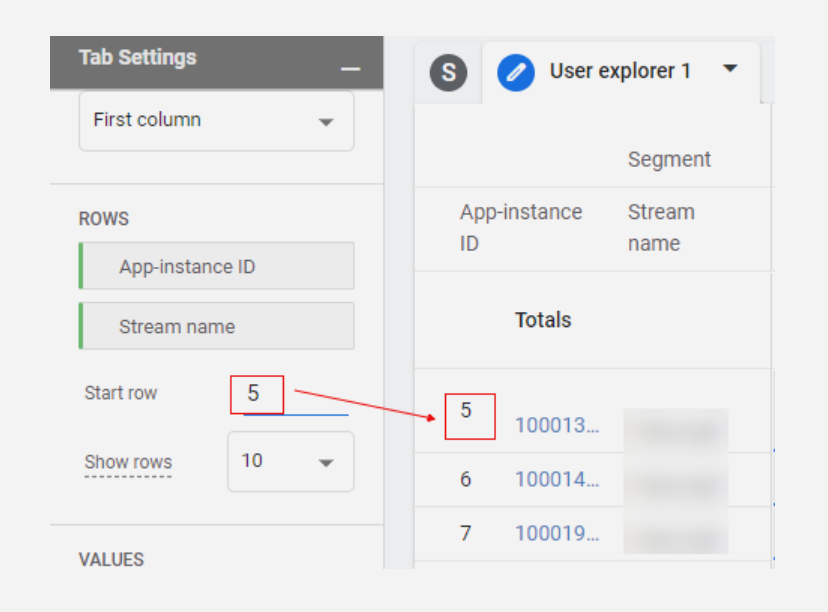
- Start Row
This customization allows you to decide which row the report should begin with. For instance, if you want to skip the first four users and start the user explorer report with the fifth one, you can simply set the Start row at 5, and the report will be generated accordingly.
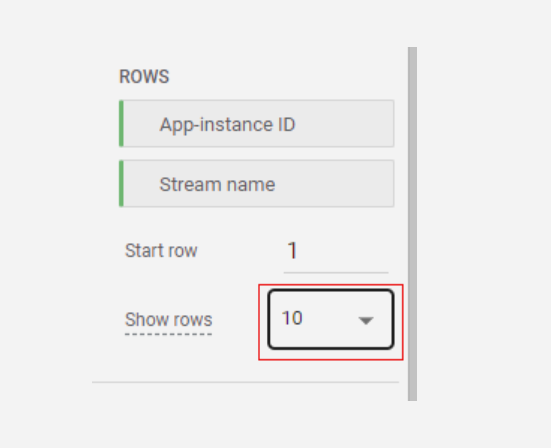
- Adjusting Rows
While the user explorer report will show ten rows by default, you can increase or decrease the number of rows for viewing. For this, select the drop-down menu in front of Show rows and select the number of rows you wish to see.
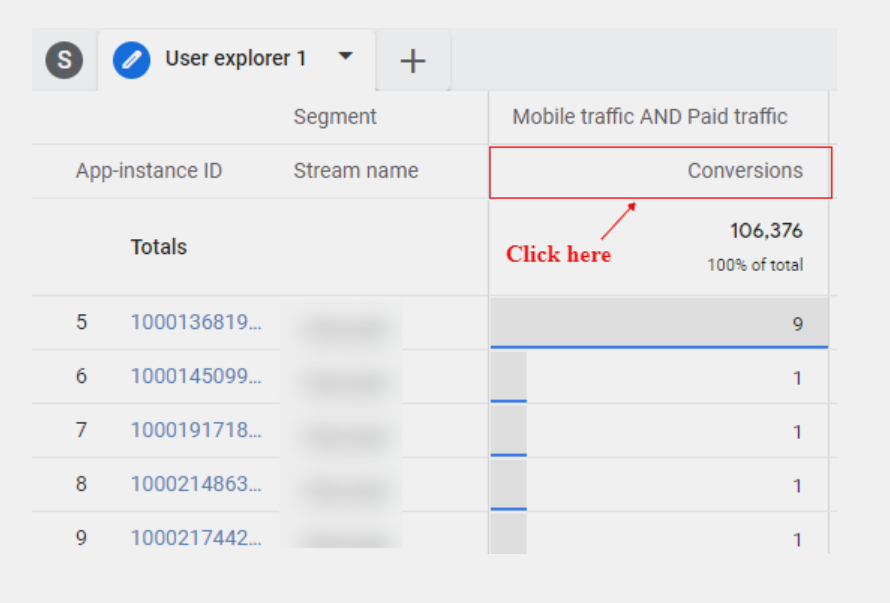
- Sorting Users
User explorer exploration report also allows you to sort users for better clarity. All you have to do is click on the metric column and the user list will be sorted in descending order.
- Customizing Cell-Type
With this, you can adjust the visualization settings of individual users. Here, you can choose between plain text, heat map, and bar by clicking on the drop-down menu in front of Cell type.
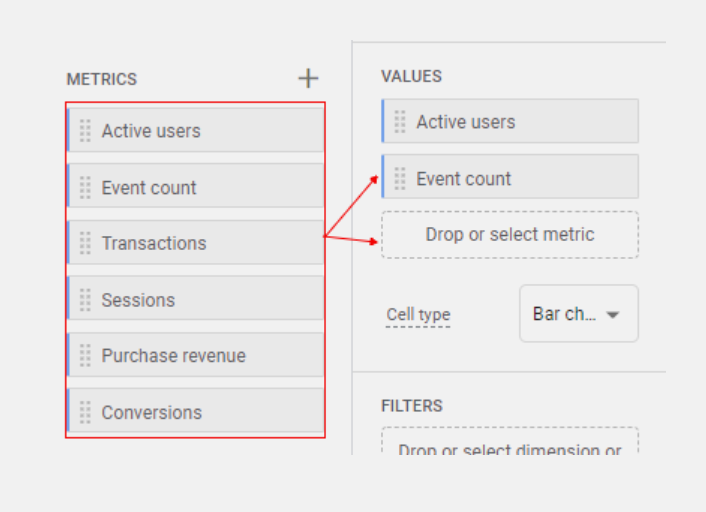
- Fixed Dimensions
The user explorer report also features some dimensions that can’t be adjusted, such as Stream Name and Device ID. However, as shown in the screenshot below, you can keep or remove specific metrics under the Value section to explore specific user data.
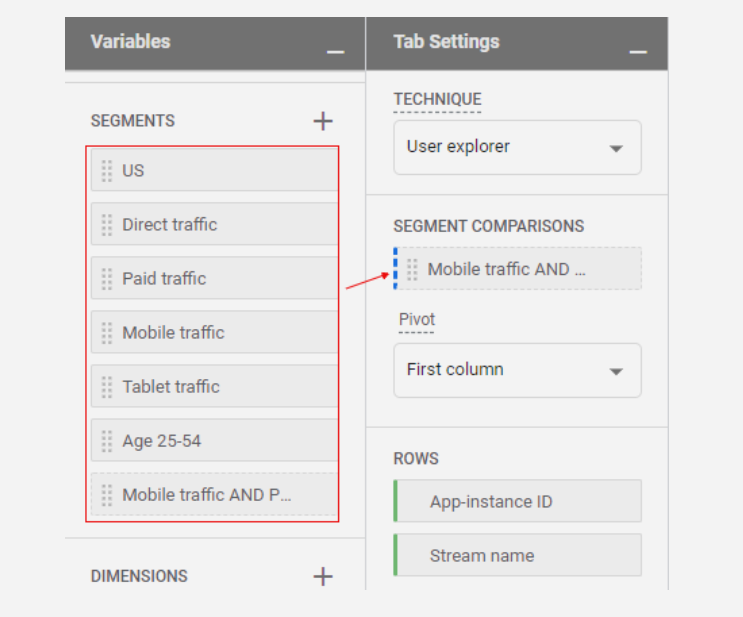
- Customizing Segments
With segments, you can define user or event subsets you want to include or exclude from your user explorer report. To apply a segment, simply drag it from the Variable tab to the Segment Comparisons tab under Tab Settings. Here’s a screenshot to guide you.
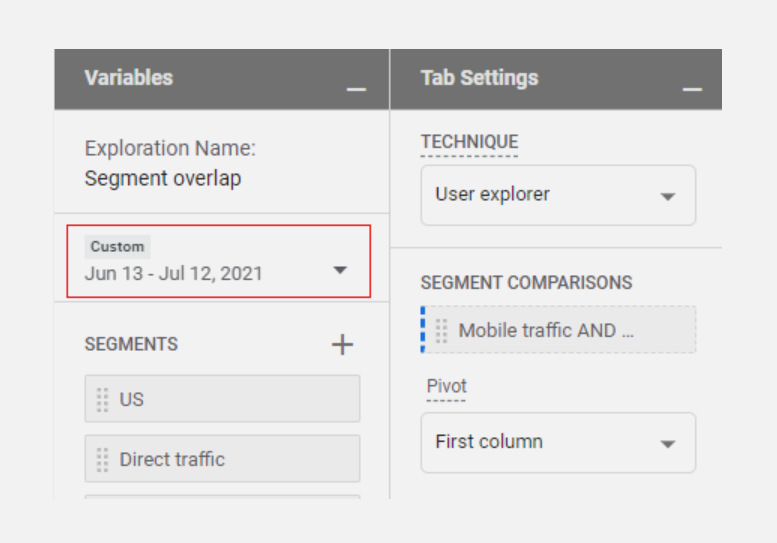
- Customizing Date Range
You can also change the date range of the user explorer report to access user information falling within a particular window. All you have to do is adjust the date range under the Variable tab. Further, you can also compare user data within one time period with another through this feature.
Testing User Explorer Report in GA4
The best way to know whether something is working is to test it. And so, to help you gain a thorough understanding of how user explorer reports work in GA4, here is a step-by-step guide to conducting a short test on your website. This short exercise will give you a deeper understanding of how GA4 collects user information and how it gets presented in your reports.
Step 1: Get Rid of Site Cookies
Doing this will give you a clean slate to work with and prevent any past sessions from interfering with your demo run. Deleting cookies from your domain will cause your client ID to be deleted as well. And this will prompt GA4 to generate a fresh one when you access the domain again. Once you’ve deleted all the cookies, close the window and access the website from a new one.
Step 2: Access Your Website and Record a New Client ID
Once you visit the website again, you’ll be allocated a new client ID. Make notes of this.
Step 3: Access Your User Explorer Report
Once you find your user explorer report, find your new client ID under App-instance ID, as seen in the screenshot below.
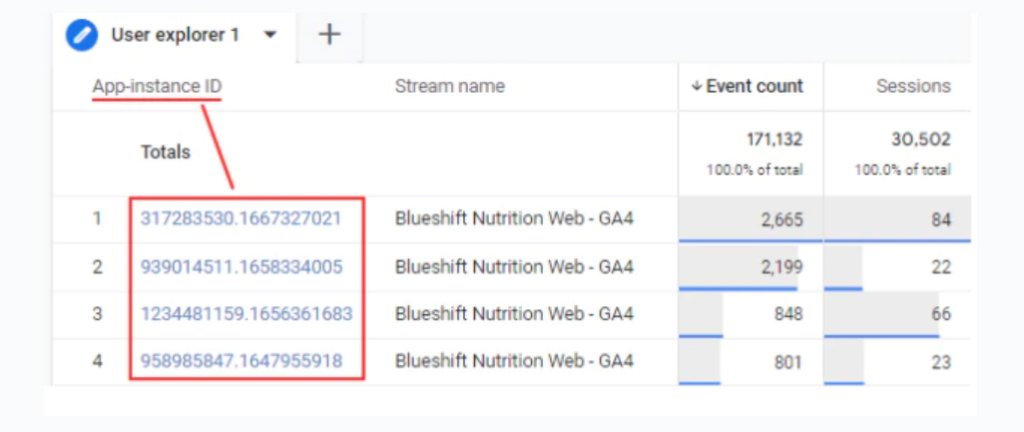
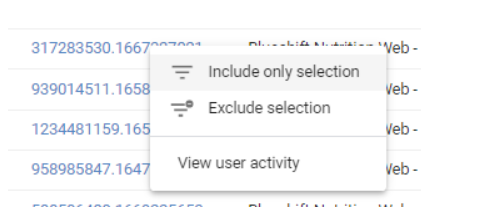
Here, you’ll notice other IDs in the list as well. To exclude this, right-click on your client ID and select Include only selection as seen in the screenshot below.
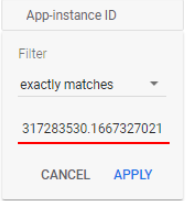
This will ensure you work only with your client ID in the user explorer report. Feed in your client ID and click Apply like below.
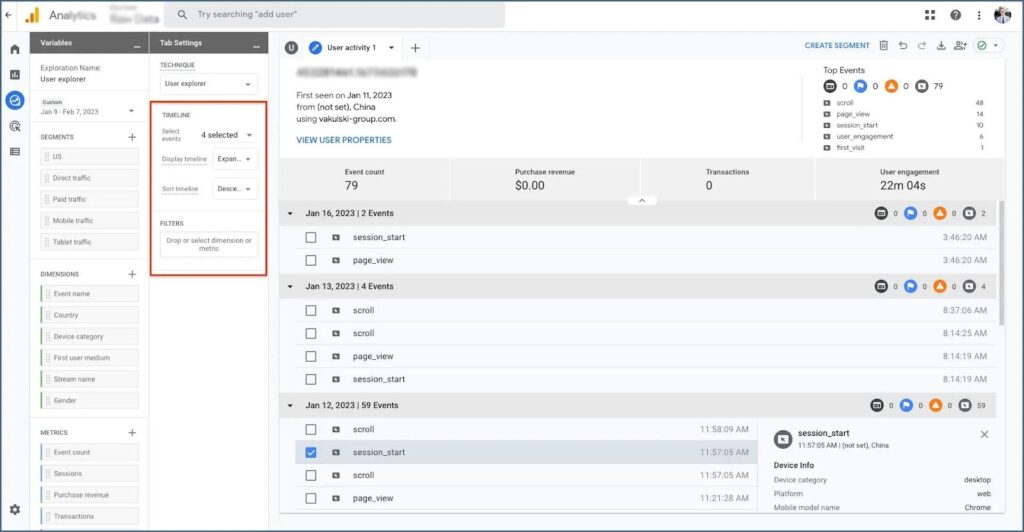
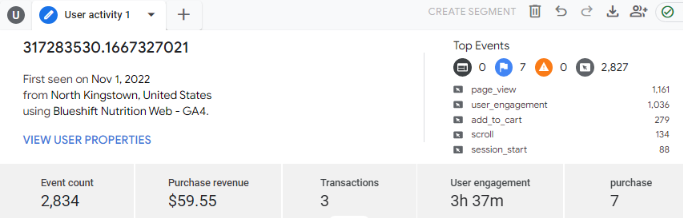
And that’s it. Now, you can explore your test session and get a concise summary of all activity generated by your client ID, as shown below.
Final Takeaway
There’s no doubt that GA4 is a big step up from its predecessor and is most definitely capable of extracting deep, meaningful marketing insights. However, GA4 suffers from one major shortcoming. This is its quota limit on API requests. As a marketer, you might find this constraining when exploring your data. But there’s an alternative in EasyInsights.
Bonus Read: How EasyInsights works with Raw GA4 Data for Data Activation and Enrichment
EasyInsights works with raw GA4 data for data activation and data enrichment in a few key ways:
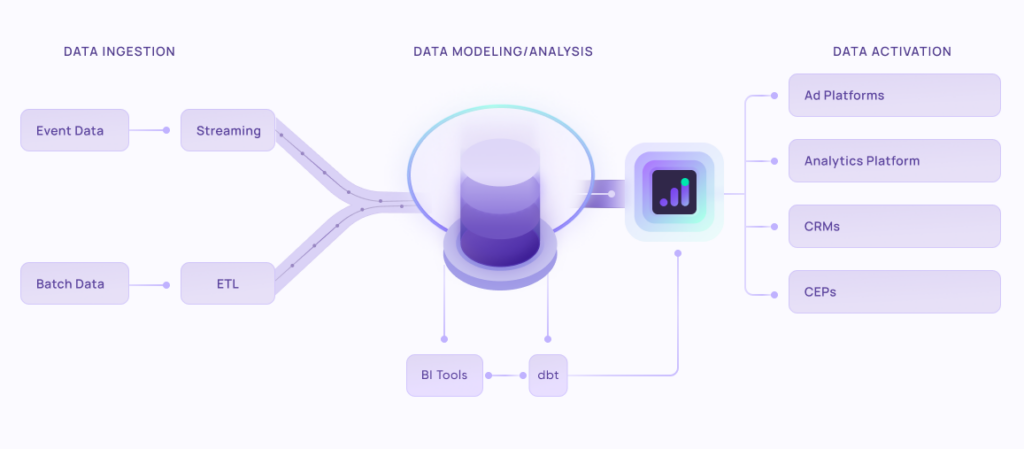
Data Collection and Transformation:
- EasyInsights connect directly to your Google Analytics 4 property allowing it to access and extract the raw GA4 data you’ve collected.
- Data Transformation: EasyInsights then cleans, normalizes, and enriches the data to make it usable for activation purposes. This may involve tasks like:
- Formatting data: Ensuring all data points are in a consistent format.
- Handling missing values: Filling in missing data points or removing them according to your preferences.
- Enriching data: Adding additional data points from other sources to create a more comprehensive picture of your customers.
Data Activation:
- Segmentation and Targeting: It allows you to segment your audience based on various criteria like demographics, behavior, and interests using the enriched GA4 data.
- Multi-channel Marketing: You can then use these segments to activate your audience across different marketing channels like email, social media, and advertising platforms.
- Customer Relationship Management (CRM): The data can be used to personalize outreach and interactions with customers within your CRM system.
- Marketing Attribution: EasyInsights can help you understand how different marketing channels contribute to conversions and optimize your marketing spend accordingly.
Key Feature:
- Offers features like customer data platform (CDP) capabilities, marketing automation, and campaign management tools.
- Focuses on reverse ETL (extracting data from your warehouse and sending it to marketing tools) and offers pre-built integrations with various marketing platforms.
EasyInsights is a marketer’s preferred tool for first party data activation.
In this age of cross-channel marketing, EasyInsights offers a comprehensive platform to collect, store, and transform all your first-party data.
EasyInsights enhances marketing campaign efficiency in a cookieless landscape with accurate ad signals. It helps brands step away from surface-level metrics and unleash the potential of first-party data to optimize marketing strategies, ensuring a superior Return on Ad Spend (ROAS). It does all this, while being a highly affordable no-code platform with an exceptional customer support apparatus.
Sign up for a demo today to see EasyInsights in action.