Funnel exploration report is one of the most useful reports in Google Analytics 4 (GA4). It gives us valuable insights into how users interact with your website, be it accomplishing a task like adding a product to a cart, filling out a form, or completing a purchase.
Insights from GA4 funnel exploration help you map user journeys from once they land on your website to the moment when they complete a desired action. It also reveals opportunities to optimize these journeys by removing unnecessary steps and broken website functionalities. That makes GA4 funnel exploration a must-have report for your marketing analytics.
So, let’s understand exactly what funnel exploration is and explore different types of funnel explorations in GA4. We’ll also walk you through steps to create custom funnel exploration. Read on.
Jump ahead to:
What Is Funnel Exploration in GA4?
Google Analytics 4 (GA4) funnel reports are used to track and analyze the conversion process on a website or app. They help us map the steps users take to complete an action on a website. Funnels are essential tools for businesses and website owners to understand user behavior and identify areas for improvement in their online conversion paths.
GA4 has two prebuilt funnel exploration reports: Purchase Journey and Checkout Journey. They are available in the Reports section under Monetization Reports. Besides, you can also create custom funnel explorations.
This is what a funnel exploration report in GA4 looks like:
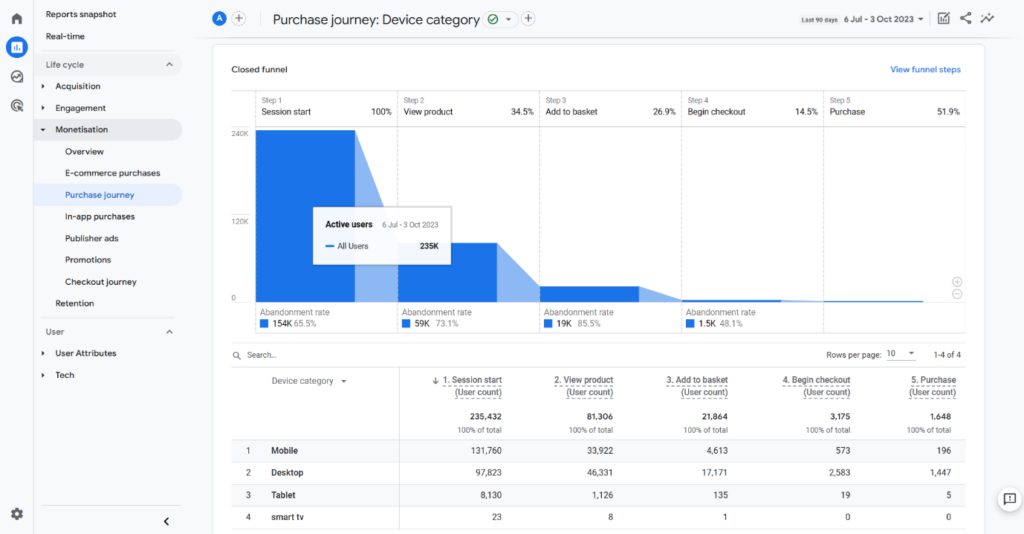
The above report is a purchase journey exploration. As you can see, the report uses bar graphs to visualize the number of users who perform a particular step. It tells us that out of the total users who started a session, how many viewed a product, added a product to the cart, and completed the purchase.
You can also see the device category dimension, which shows the type of device visitors use to visit your website. You can select more dimensions such as country, browser, language, etc.
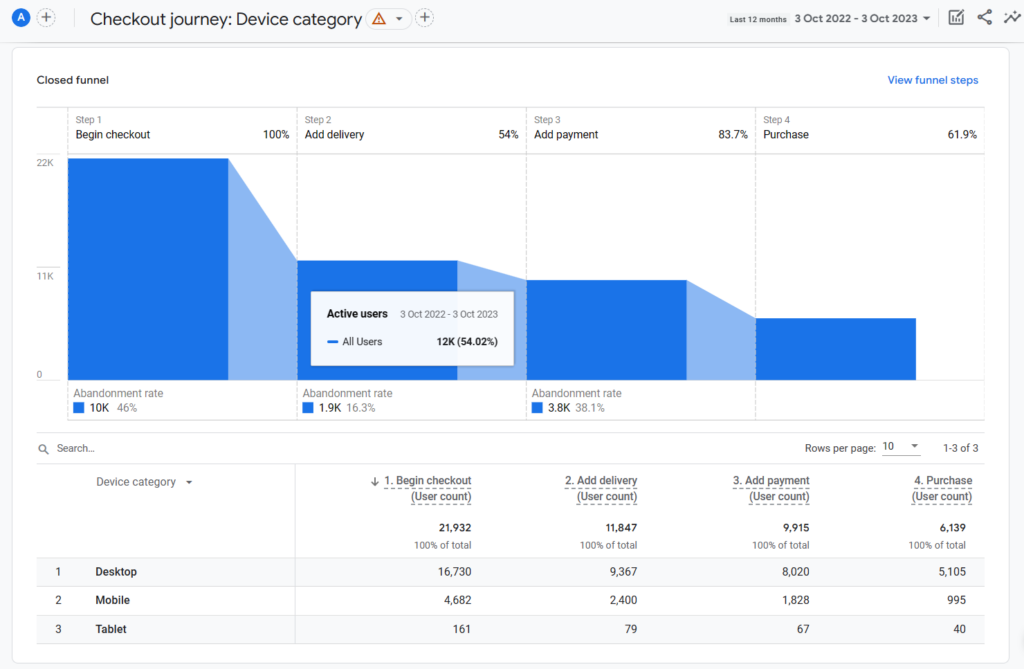
Similarly, checkout journey exploration maps steps users take after initiating the checkout process till the completion of the purchase. Below is the snapshot of the GA4 checkout journey report.
Additional Read: A Complete Guide to Explorations in GA4
What Makes GA4 Funnel Exploration Reports Important
Funnel exploration is mostly used by marketers who manage an e-commerce website and want to map their users’ purchase journeys. But there’s more to funnel exploration. Let’s have a detailed look at how you can use the GA4 funnel exploration report to your advantage.
1. Conversion Tracking
Conversion tracking is essential to measure the success of your marketing campaigns. And funnel exploration helps you with conversion tracking. You can use it to map steps users take to complete a conversion, be it signing up for a newsletter, completing a purchase, filling a form, downloading a file, etc.
2. Identify Abandonment Points in Conversion Paths
Not all users who visit your website convert. Few drop off the conversion journey at some point before converting. The journey abandonment point could be a web page, a form, a button, etc. And GA4’s funnel exploration report reveals these drop-off points.
Equipped with this valuable insight, you can review these points and identify what issues cause users to bounce. Whether it is a poorly designed web page, broken link, or confusing checkout process, you can take steps to fix them.
3. Optimize User Journeys
Funnel exploration visualizes all steps users take to complete a conversion. You get exact numbers for each successful movement to consecutive steps. It allows you to review your conversion path, identify issues with the path, and optimize it to reduce friction in the conversion journey.
4. A/B Test Your Website Structure
Marketers generally have multiple website designs in their mind. So, they A/B test them on various parameters to pick the one that performs the best. You can use funnel exploration to test different designs and structures to see which generates more conversion. So, instead of relying on intuition, you have data to back your decision.
Additional Read: Everything You Need to Know About Data Sampling in GA4
Creating a Funnel Exploration Report in GA4
Let’s create a custom funnel exploration in GA4 from scratch. We want to make a funnel exploration that will show us the count of users who started a session and viewed a product and went on to purchase it.
Our funnel will have four steps tracking an event corresponding to each step, like session_start, item_viewed, add_to_cart, and purchase. So, let’s begin.
Step 1. Log in to your Google Analytics 4 property.
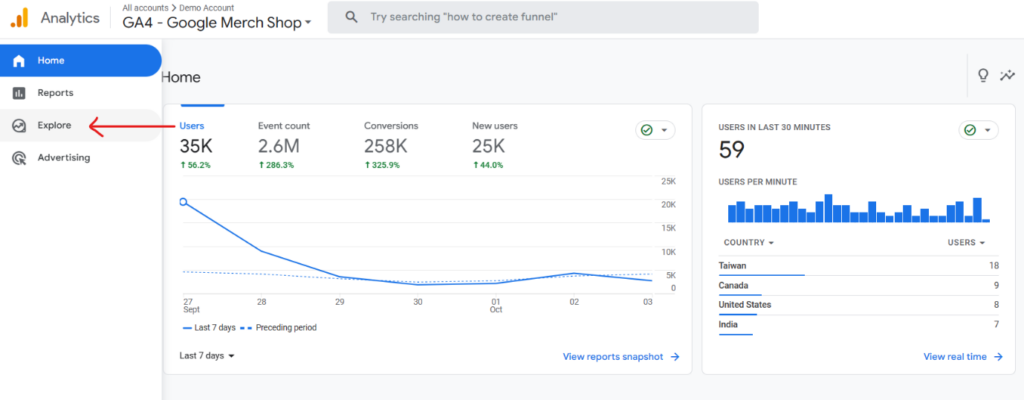
Step 2. Head over to the navigation menu on the left side of your screen and click Explore.
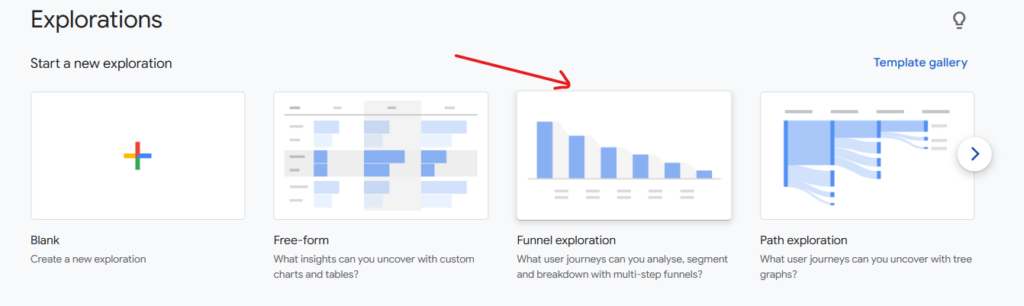
Step 3. Now click on the Funnel exploration template.
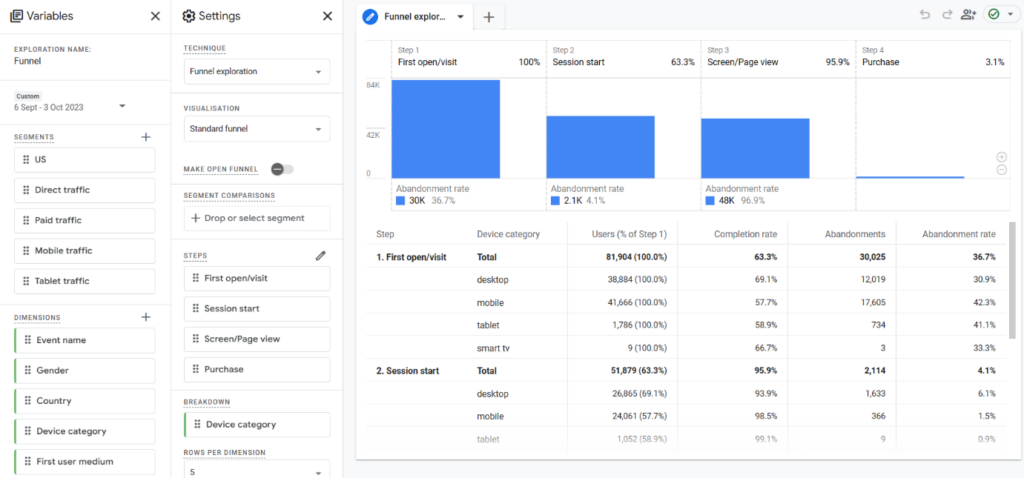
Step 4. You should see a screen with three tabs – Variables, Settings, and Report tab.
- The variables tab is where you’ll select your report’s date range, segments, dimensions, and metrics.
- The settings tab lets you pick the steps of the funnel, create segments, and use dimensions to break down your report further.
- The tab on the right-hand side of the screen is your funnel exploration report.
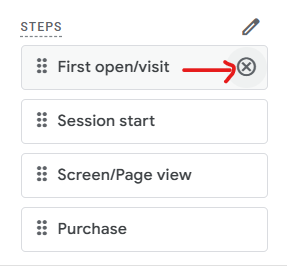
Step 5. The report we are seeing is the default funnel exploration template. However, we want to create a custom report to track different steps and events. For that, we’ll head over to the Steps section in the Settings tab and remove every existing step by clicking x icon.
Step 6. Now that we have a clean slate, let’s create a custom funnel exploration. Click the Pen icon in front of the Steps section and move on to the next step.
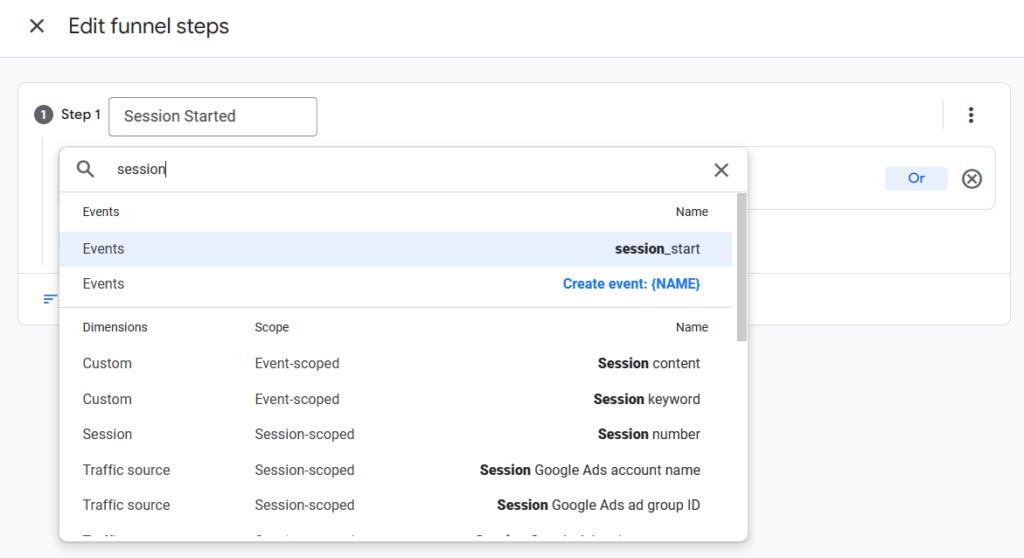
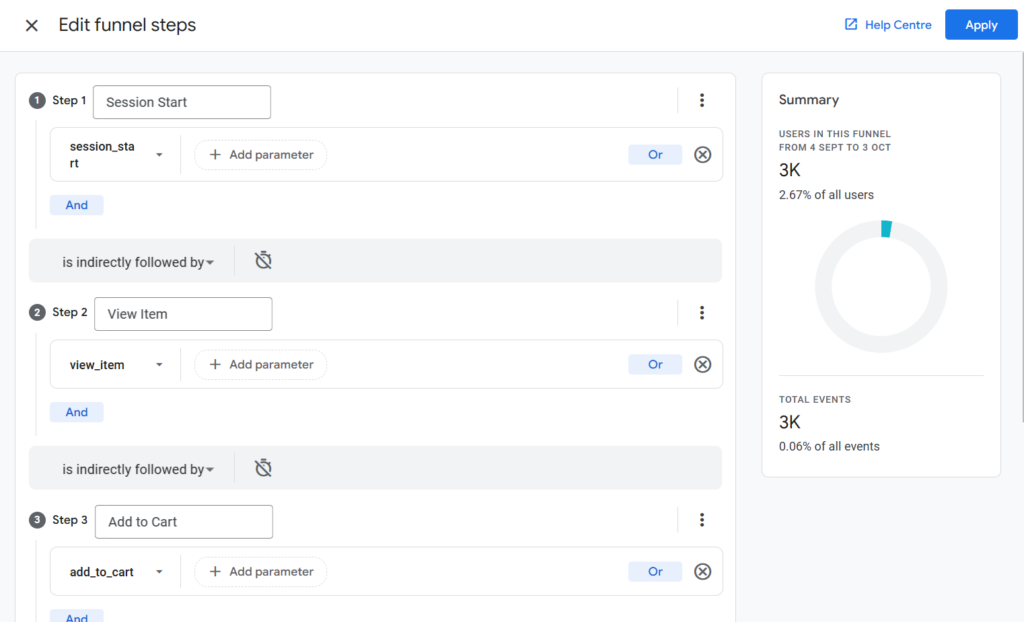
Step 7. In the Edit funnel steps overlay, we’ll name the first step as Session Started. Then, click Add new condition > Events > session_start.
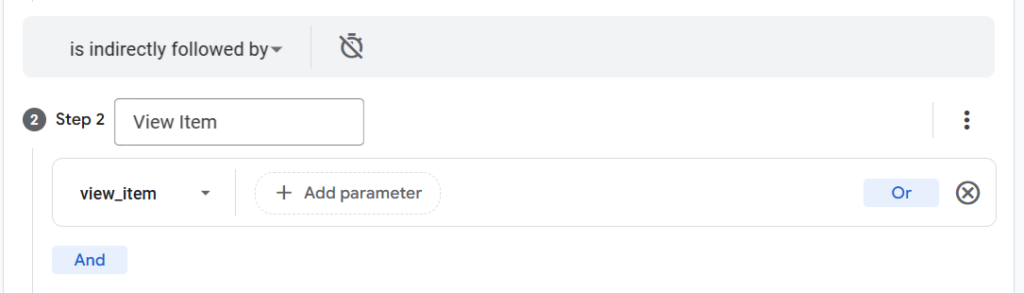
Step 8. Now, to add the next step of the funnel, i.e., Item Viewed, click the Add step option. Then, name the step and click Add new condition > Events > item_viewed.
Similarly, add the last two steps. For the third step, pick the add_to_cart event. And for the fourth step, select the purchase event.
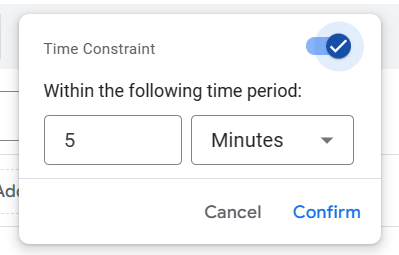
Step 9. You must have noticed the little clock icon in each step. Click it, and you get a toggle to enable the Time Constraint option.
Here, you can set the time period within which the next step must take place for it to be included in your funnel.
Step 10. Once you have configured all the steps and set the time constraint. Click Apply and your GA4 funnel exploration report is ready.
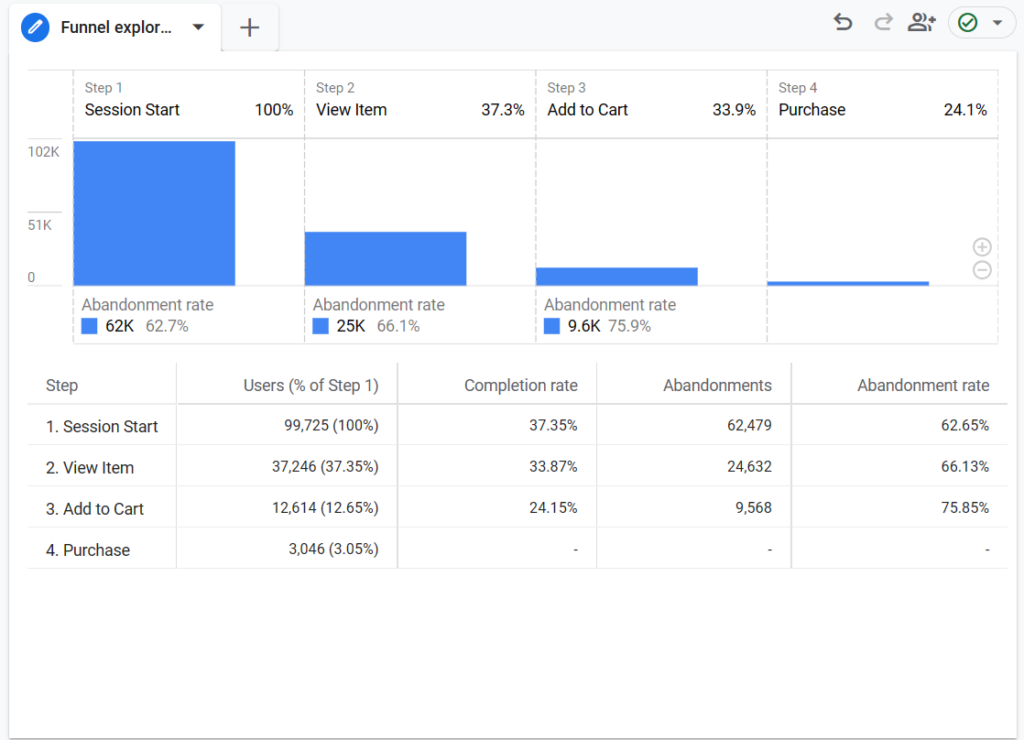
We can see that around 99,725 users started a new session, out of which only 3,046 reached the end of our funnel, i.e., completed a purchase. You can also see that the report uncovers metrics like:
- Users, i.e., the exact count of users at each step. In brackets, they are also conveyed as percent of step 1.
- Abandonment rate, i.e., percentage of users who dropped off the funnel at a given step.
- Abandonments, i.e., the exact number of abandonments at each step.
- Completion rate, i.e., percentage of users who complete a given step.
A key takeaway from this report is that the third step in our funnel, i.e., Add to Cart, has the highest abandonment rate. It shows that many customers drop off the funnel at this step. It is a sign for us to review our checkout page and see if it has any issues like poor design, complicated forms, etc.
Additional Read: Learn to Use Standard Reports of GA4
Funnel Exploration: Use Cases
We can further tweak the settings of our funnel exploration to gain more granular insights. Let’s have a look at some settings for GA4 funnel exploration.
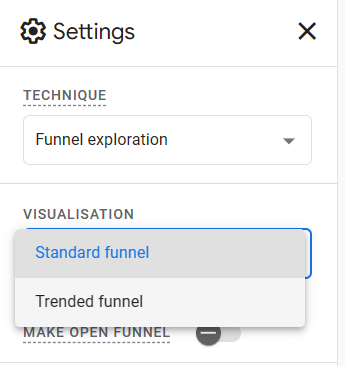
1. Visualization
The funnel exploration report we created so far uses the standard funnel visualization. It uses a bar graph to visualize the total number of active users at each step. But we also have an alternate visualization for our exploration.
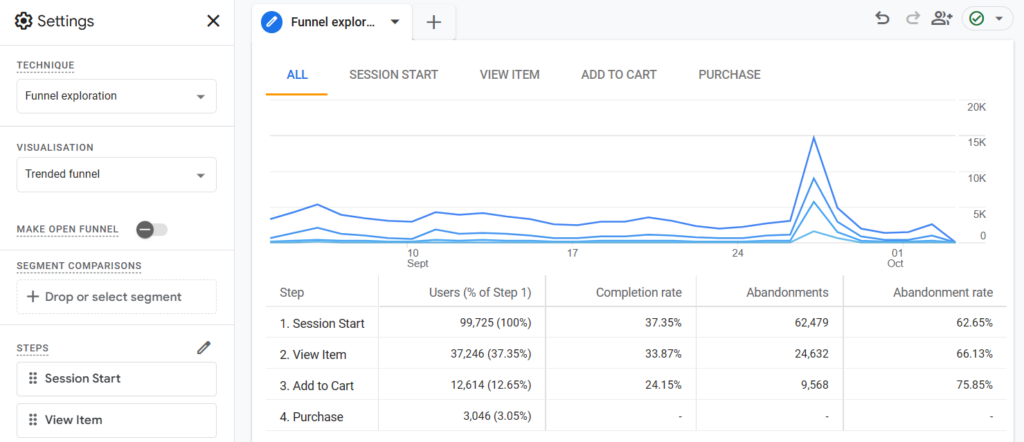
Head over to the Settings tab, click the drop-down menu for Visualization, and select Trended funnel. The trended funnel uses a line graph to visualize active users’ data for each step.
Trended funnel report has multiple sections. The All section is where you see multiple line graphs for every step in the user journey. Apart from that, each step you add to your funnel gets a separate section where you only see a line chart for that very step.
2. Segment Comparisons
We can also segment data for users at every step using segments. By default, you’ll see segments like country name and traffic type in the Segments section of the Variables tab.
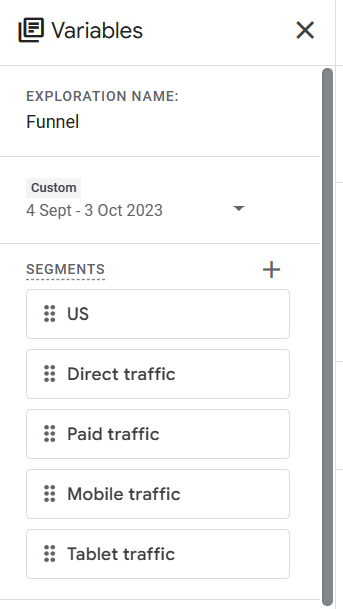
Drag the desired option and drop to the Segment Comparisons section of the Settings tab. Here, we have created a segment showing users who either brought organic traffic or paid traffic.
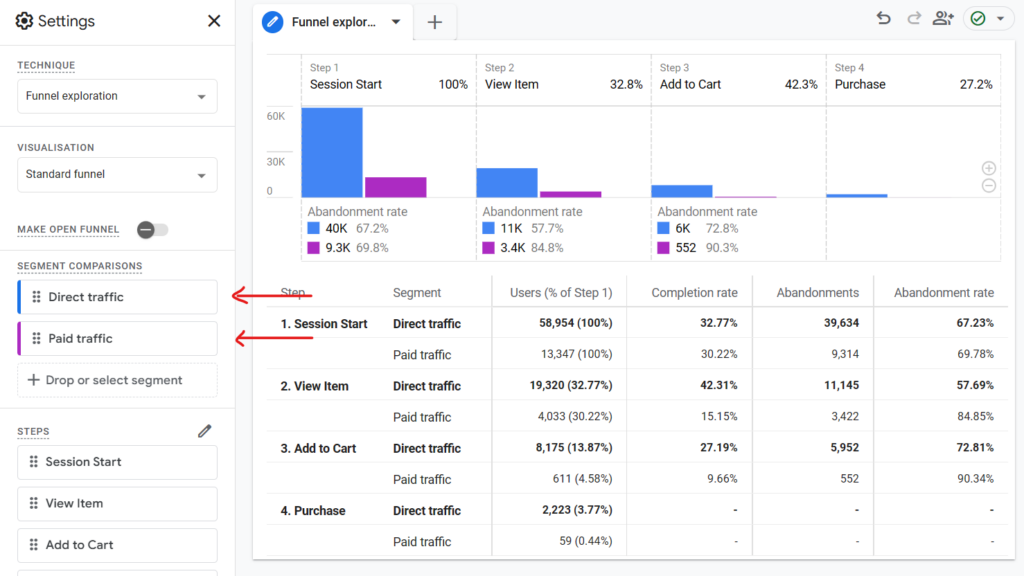
We can see that the report now has two bar graphs for each step. The blue one shows direct traffic, while the violet bar shows paid traffic. We can also see metrics like abandonments, abandonment rate, etc., for these traffic types.
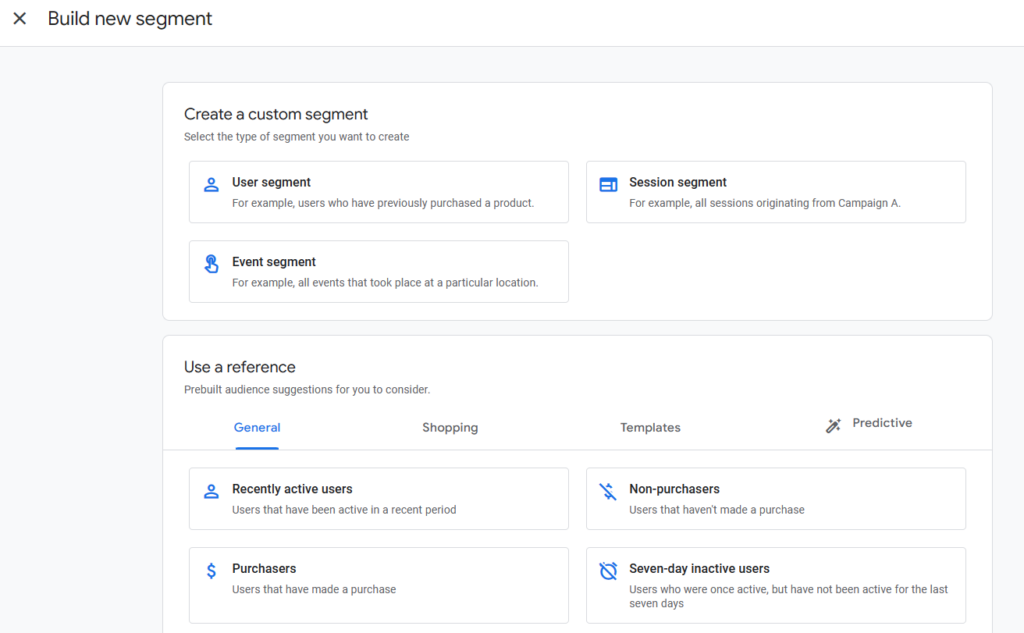
You can also build new segments other than the default options. Click the + icon next to the Segments section of the Variables tab.
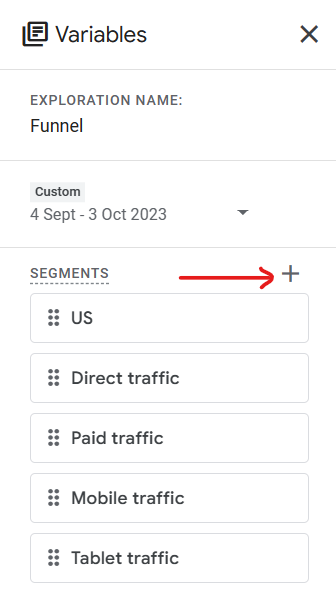
It will open an overlay called Build New Segment. Here, you can either create a custom segment or pick one from the categories like General, Shopping, Templates, and Predictive.
3. Breakdown
As the name suggests, the breakdown option in GA4 reports breaks down the data into subgroups. All you have to do is pick a dimension from the Dimensions section of the Variables tab and drop it in the Breakdown section of the Settings tab.
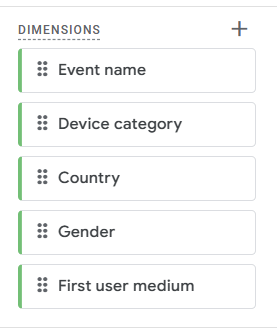
Here, we have used the Device category dimension to break down active users’ data based on their device type.
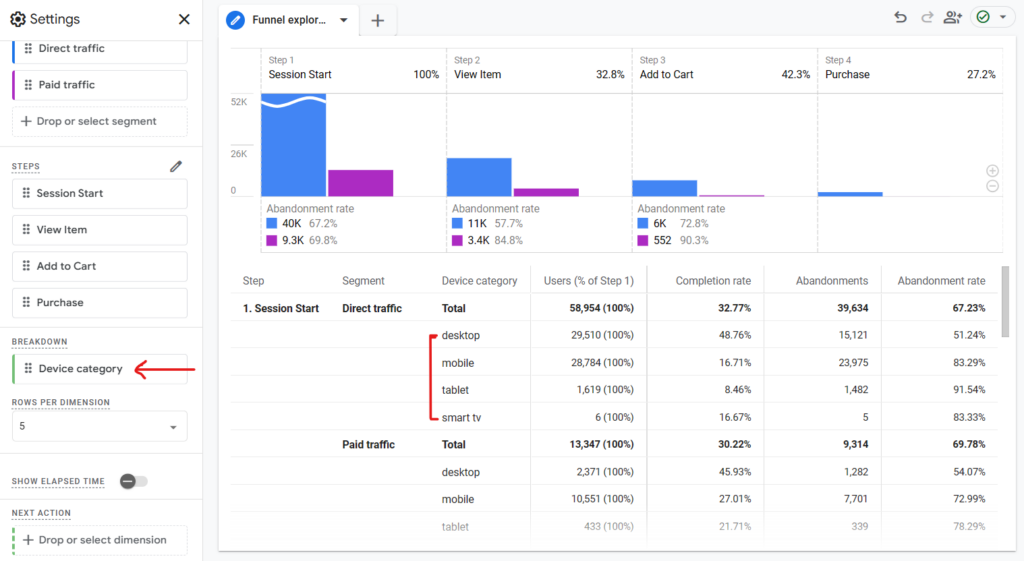
You can see that most visitors use the desktop to visit our website. We can also see that most abandonments are from users on mobile devices, tablets, and smart TVs. It may be a sign that the website isn’t optimized for these devices, which hinders user experience and forces them to drop off their purchase journey.
4. Filters
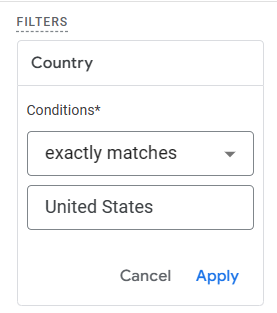
We can also filter data of our funnel exploration report. Again, we’ll use a dimension to create a filter. Click the + icon below Filters, and pick a dimension.
We want to filter data for American visitors. We will pick the Country dimension, specify the filter’s condition as Exactly matches, and set United States as the expression. Hit Apply, and we’ll have data for visitors from United States in our funnel.
5. Open Funnel
The funnel report that we have created is a closed funnel. What does it mean? A closed funnel only shows users who enter at the first step in the funnel.
Suppose your funnel has three steps – 1, 2, and 3. A closed funnel will only include users who start at Step 1. They won’t be counted if they enter the funnel at step 2 or 3. This type of funnel is helpful when you want users to not only accomplish a task but also use the specified path to accomplish it.
On the contrary, an open funnel shows data for users who enter at any step in the funnel. Let’s again take the example of a 3-step funnel with steps 1, 2, and 3. An open funnel will also include users entering the funnel at steps 2 and 3, not just step 1.
It helps us analyze data for even those users who may skip a step in our funnel. Closed funnel exploration should be used when task completion takes precedence, regardless of users’ path.
Simply toggle the Make Open Funnel button in the Settings tab of your funnel exploration, and your open funnel report will be ready. Your report will now divide the user count into new funnel entries and continuing funnel entries.
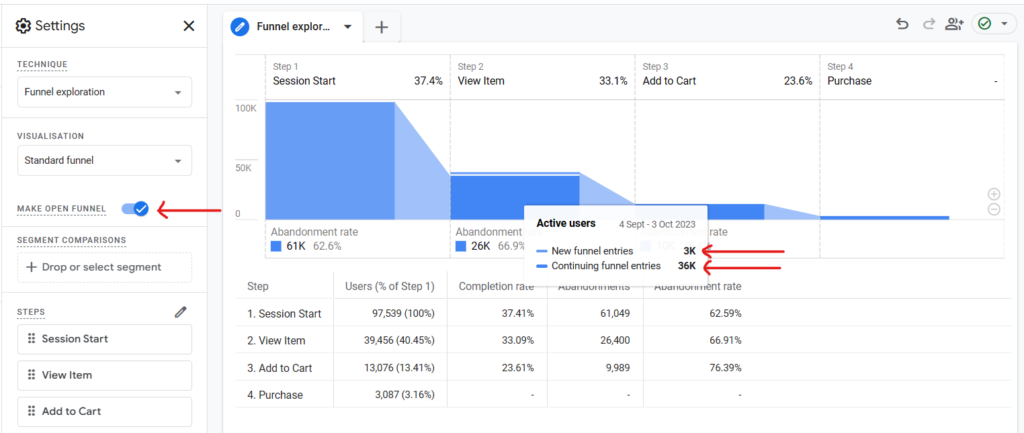
New funnel entries are the users who enter at that step, skipping the previous steps. However, the continuing funnel entries are users who arrive at a particular step after completing the previous step.
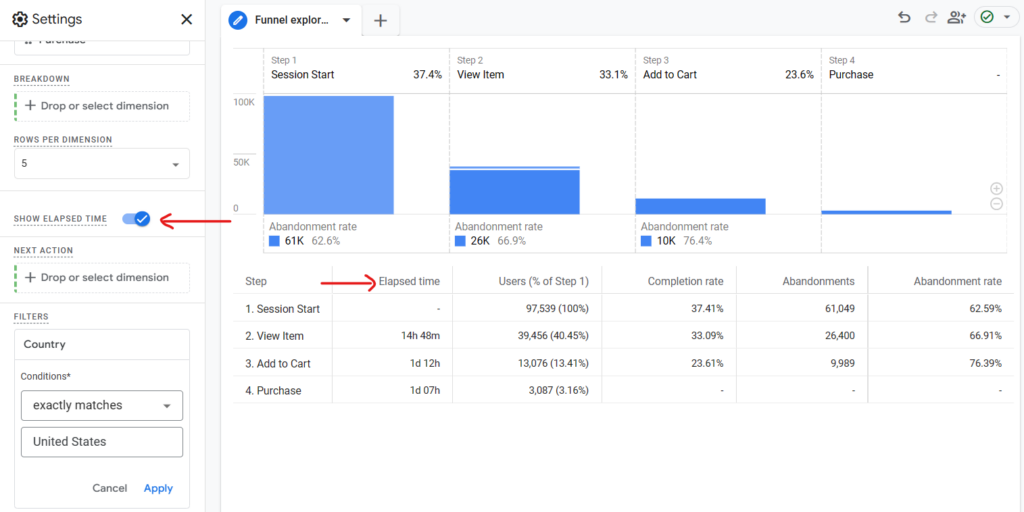
6. Show Elapsed Time
The Time Elapsed setting in GA4 funnel exploration is a function that allows you to show the average time elapsed between funnel steps.
While Universal Analytics calculated the time between page views, GA4 lets you see the time elapsed between user actions on your site. This can help you understand how long it takes for users to complete a task or goal and where they might experience delays or difficulties.
You can enable the Show elapsed time option in the Settings tab of your report. Once enabled, your report will add a column for elapsed time below the visualization.
Additional Read: 10 Ways GA4 is Better than UA
Wrapping Up
Funnel exploration report in GA4 lets you map how users interact with your website. You can visualize the steps users take toward a conversion. The report also shows how many users abandon their conversion journey and how many users complete it.
The insights from this report also help you identify issues with your website that may force users to bounce, be it design, structure, or any technical issue. That makes GA4 funnel exploration an essential report for your marketing analytics.
A serious marketing analytics workflow needs few tools other than Google Analytics. One such tool is EasyInsights, a complete no-code marketing data activation platform.
EasyInsights allows you to automate data sync from over 500 sources, including CRMs, email automation tools, data analytics tools, etc., Check out our bonus read to find out how you can work with EasyInsights!
Bonus Read: How EasyInsights works with Raw GA4 Data for Data Activation and Enrichment
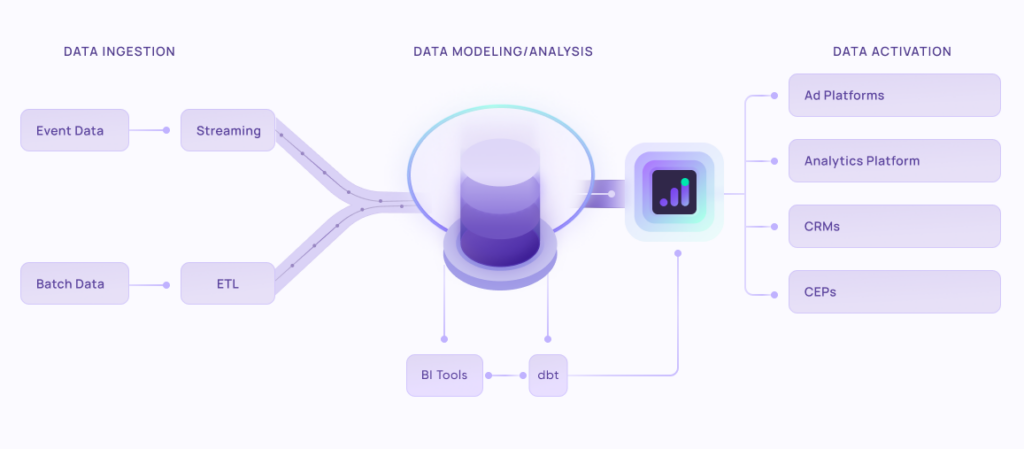
EasyInsights works with raw GA4 data for data activation and data enrichment in a few key ways:
Data Collection and Transformation:
- EasyInsights connect directly to your Google Analytics 4 property allowing it to access and extract the raw GA4 data you’ve collected.
- Data Transformation: EasyInsights then cleans, normalizes, and enriches the data to make it usable for activation purposes. This may involve tasks like:
- Formatting data: Ensuring all data points are in a consistent format.
- Handling missing values: Filling in missing data points or removing them according to your preferences.
- Enriching data: Adding additional data points from other sources to create a more comprehensive picture of your customers.
Data Activation:
- Segmentation and Targeting: It allows you to segment your audience based on various criteria like demographics, behavior, and interests using the enriched GA4 data.
- Multi-channel Marketing: You can then use these segments to activate your audience across different marketing channels like email, social media, and advertising platforms.
- Customer Relationship Management (CRM): The data can be used to personalize outreach and interactions with customers within your CRM system.
- Marketing Attribution: EasyInsights can help you understand how different marketing channels contribute to conversions and optimize your marketing spend accordingly.
Key Feature:
- Offers features like customer data platform (CDP) capabilities, marketing automation, and campaign management tools.
- Focuses on reverse ETL (extracting data from your warehouse and sending it to marketing tools) and offers pre-built integrations with various marketing platforms.
EasyInsights is a marketer’s preferred tool for first party data activation.
In this age of cross-channel marketing, EasyInsights offers a comprehensive platform to collect, store, and transform all your first-party data.
EasyInsights enhances marketing campaign efficiency in a cookieless landscape with accurate ad signals. It helps brands step away from surface-level metrics and unleash the potential of first-party data to optimize marketing strategies, ensuring a superior Return on Ad Spend (ROAS). It does all this, while being a highly affordable no-code platform with an exceptional customer support apparatus.
Sign up for a demo today to see EasyInsights in action.