Do you ever wonder how your visitors reach that particular web page on your site? Or what actions do they perform before and after triggering a certain event? How do they navigate the labyrinth of web pages you’ve meticulously crafted? That’s where we turn to the Path Exploration Report in Google Analytics 4 (GA4).
GA4’s path exploration report helps us track and analyze the various paths users take as they interact with our website content, be it events they trigger or pages they visit. That’s why, whether you are an analyst or a marketer, knowing the ins and outs of GA4’s path exploration is key to unlocking actionable insights into user behavior.
So, join us as we explore the path exploration report in GA4 and understand why they are useful for your marketing analytics. We’ll also walk you through the steps to create one for your GA4 property. Read on.
Jump ahead to:
What Is Path Exploration in GA4?
Path exploration is one of the many explorations available in GA4. It allows us to track the sequence of pages users visit and actions they take on a website. In other words, it allows us to assess user behavior before and after visitors visit a certain page or perform a specific action.
It uses a tree graph to visualize steps in the path users take to navigate your website. You can see the image below to understand what a GA4 path exploration tree graph looks like.
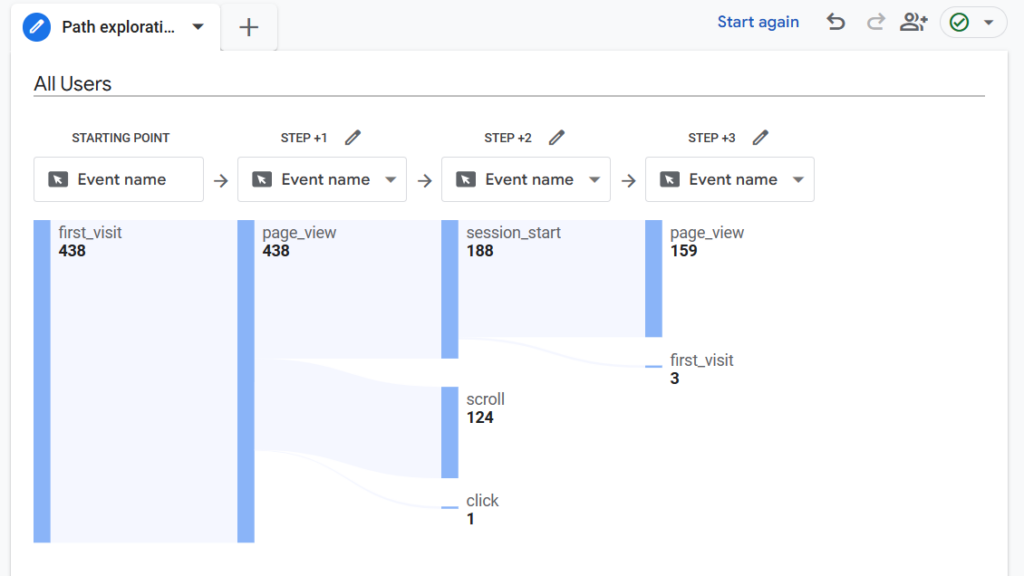
This path exploration tree graph shows that around 438 visitors on a website were first-time visitors for the selected time frame. After they landed on the website, they triggered the first_visit event. Then, they went on to trigger page_view next.
Of these 438 first-time visitors, 188 started a session, 124 scrolled, and only one first-time visitor generated a click event.
Additional Read: A Complete Guide to Explorations in GA4
The Way Path Exploration Works
A path exploration report in GA4 has four key elements. Let’s go over each element to see how path exploration works.
- Starting and Ending Point: The starting point is the page or event that begins the path, while the ending point is the page/event that ends it. Your report can only have a starting or ending point, not both.
- Steps: Steps are actions users take before the ending point or after the starting point. A path exploration report visualizes steps as columns in a tree graph.
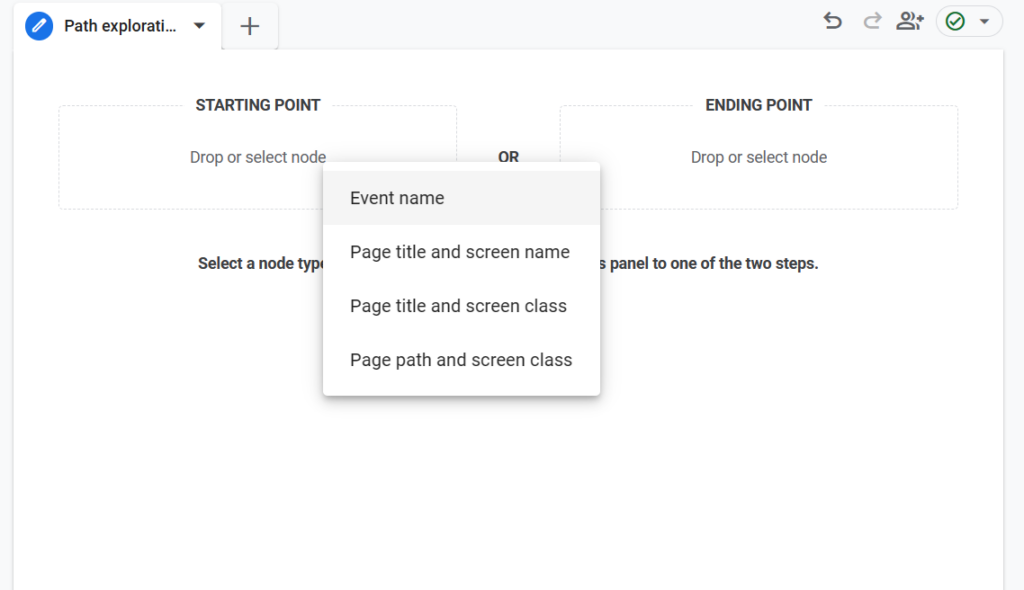
- Nodes: Nodes are the data points for a given step in a path exploration. You get four nodes in GA4 – event name, page title and screen name, page title and screen class, and page path and screen class. When you select an event name, nodes signify the total number of events triggered by users. However, if you choose the other three options, the node equals the total number of users.
- Path: A path is made up of a sequence of nodes that occur across one or more steps. The path will show you the total events triggered and pages viewed before or after the selected starting or ending point.
Using Path Explorations for Understanding User Journey
Here are some common use cases of GA4’s path exploration report:
1. Find Top Performing Pages
The most common use is to find the pages most visited by users after landing on your website’s home page. It gives you an idea into what is the intent of your visitors. Are they looking for a product? Maybe a piece of content? Path exploration makes the answer very clear.
2. See Previous Steps and Next Steps in the User Journey
You can take an event, be it a purchase or any other conversion, and use path exploration to assess the steps users take to reach that event. Similarly, you can see what steps users take after triggering the selected event.
Path exploration helps you assess the impact of one step or event on the adjacent event. Equipped with the insights, you can explore the opportunities to remove any friction or issues users may face when moving from one step to another.
3. Identify Pages and Events Where Users Get Stuck
When designing a website, you have a picture of how a user may reach the desired page. This report can reveal events and pages that obstruct users’ journeys instead of guiding them to those pages.
For instance, there may be a CTA with a broken link, a page may not display content, or a checkout button may not work. These issues can force users to bounce or create looping sequences. You can easily identify these issues using GA4’s path exploration and take corrective measures.
Path Exploration and Conversion Paths: A Comparison
If you’ve used Google Analytics 4, you must be aware of a report called Conversion Paths. Then you must wonder how it is different from path exploration.
The conversion paths report is available in the Advertising section, while the path exploration report is part of the Explorations section.
A conversion path report shows you the specific series of steps a user takes on your website, leading to a predefined conversion goal. However, a path exploration report helps you examine users’ various paths as they interact with your website without focusing on any specific conversion goal.
Additional Read: Guide to Cohort Analysis and GA4 Cohort Exploration
Creating a Forward-Moving Path Exploration Report in GA4
Now that you’ve got the overview of the GA4 path exploration report let’s walk you through the steps to create a path exploration for your website.
Step 1. Sign in to your Google Analytics 4 property.
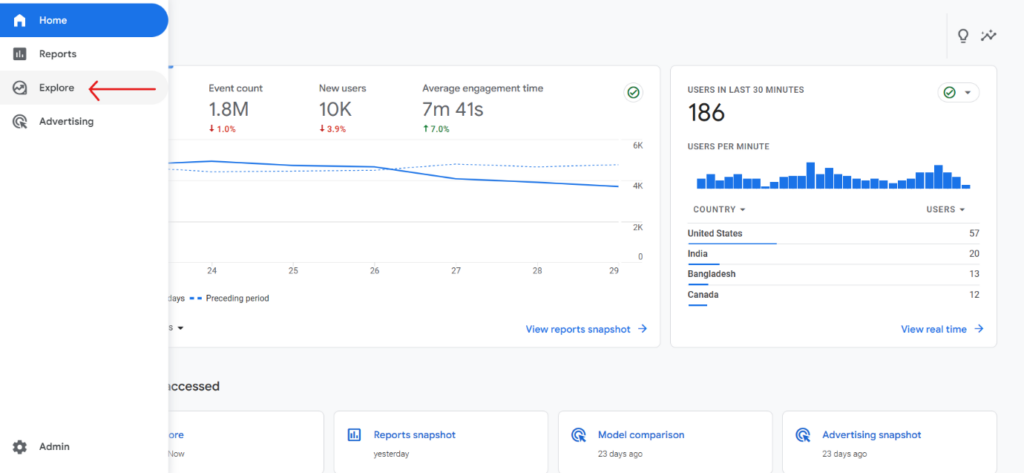
Step 2. Head over to the navigation menu on the left side of the screen and click Explore.
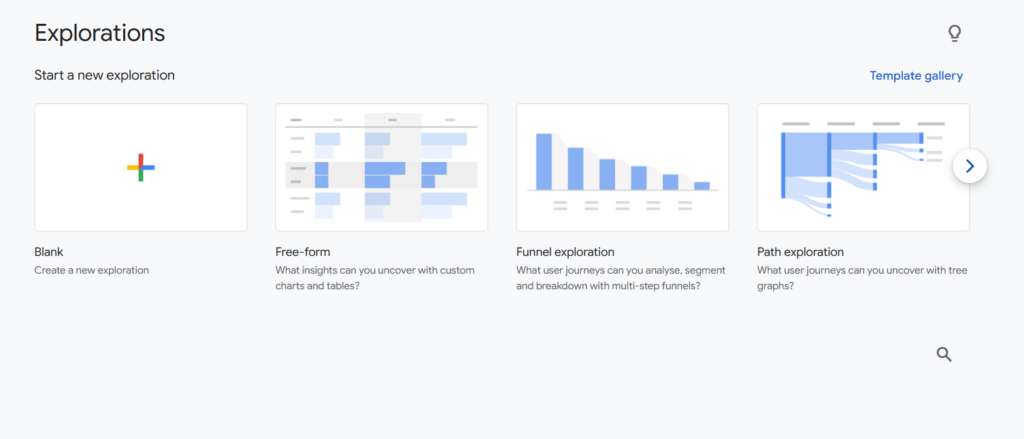
Step 3. You are now in the Explorations section. You can either select a prebuilt path exploration template or start afresh with a blank one. We will click Blank to create a new path exploration.
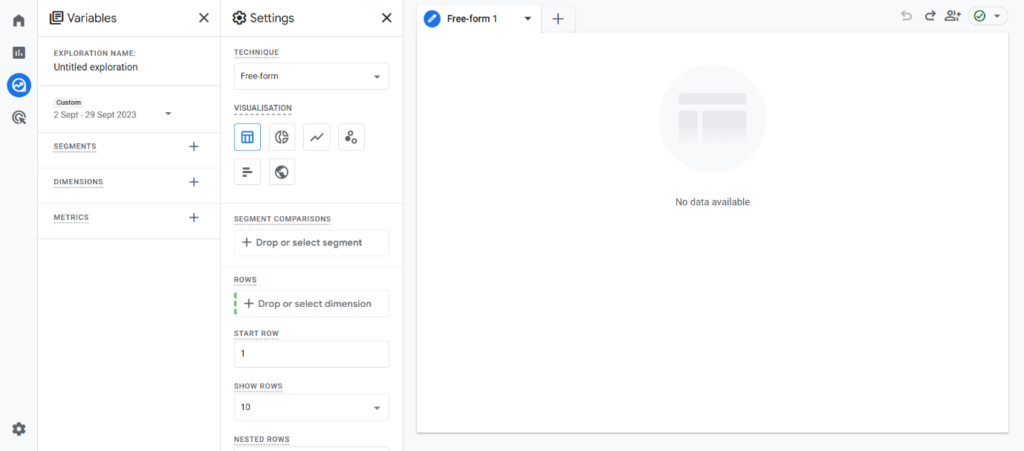
Step 4. Next, you’ll see a screen with three tabs – Variables, Settings, and a tab for your report.
- The variables tab allows you to select your report’s date range, segments, dimensions, and metrics.
- The settings tab allows you to pick the technique (report type) like free form, path exploration, cohort analysis, etc. It also shows options and toggles based on the technique of the report you select.
- The tab on the right-hand side of the screen is where your report will appear.
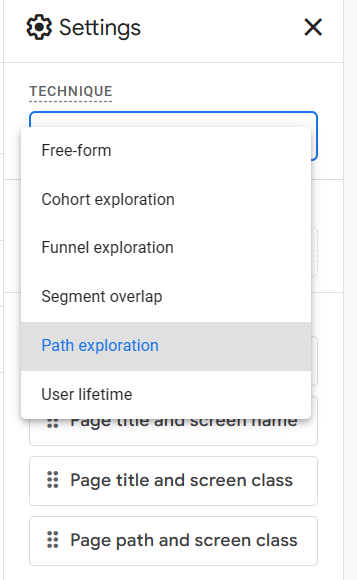
Step 5. Click the drop-down menu Technique option in the Settings tab and pick Path Exploration. It will open the default path exploration report, as shown below.
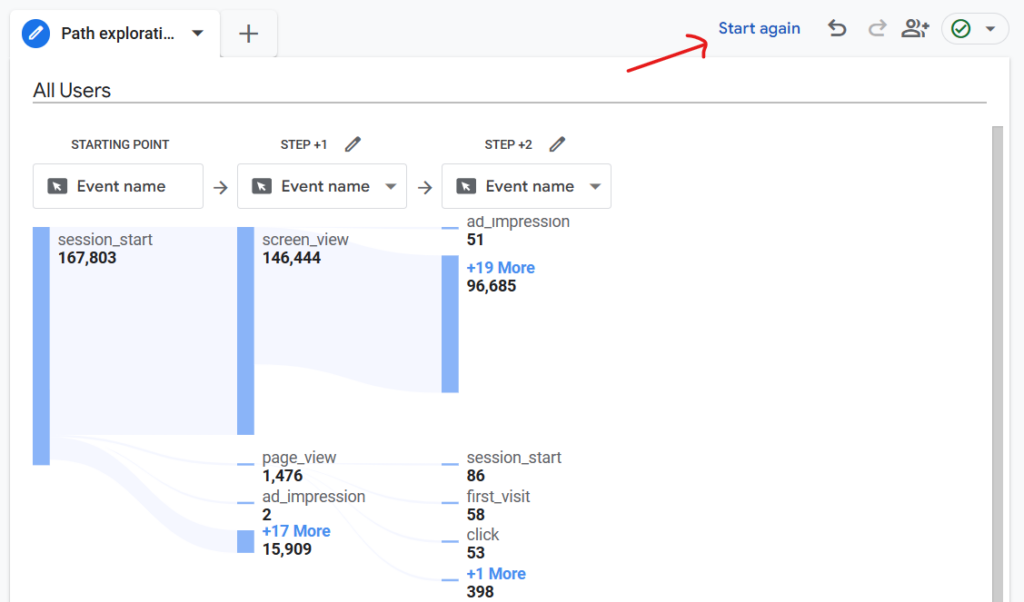
Step 6. We can create a new path exploration by clicking the Start Again option above the report tab.
Step 7. Now, pick the starting point and then select any of the four nodes. Alternatively, you can drag and drop a node from the Settings tab to either the starting point.
Here, we have selected the Event node as the starting point for our path exploration report.
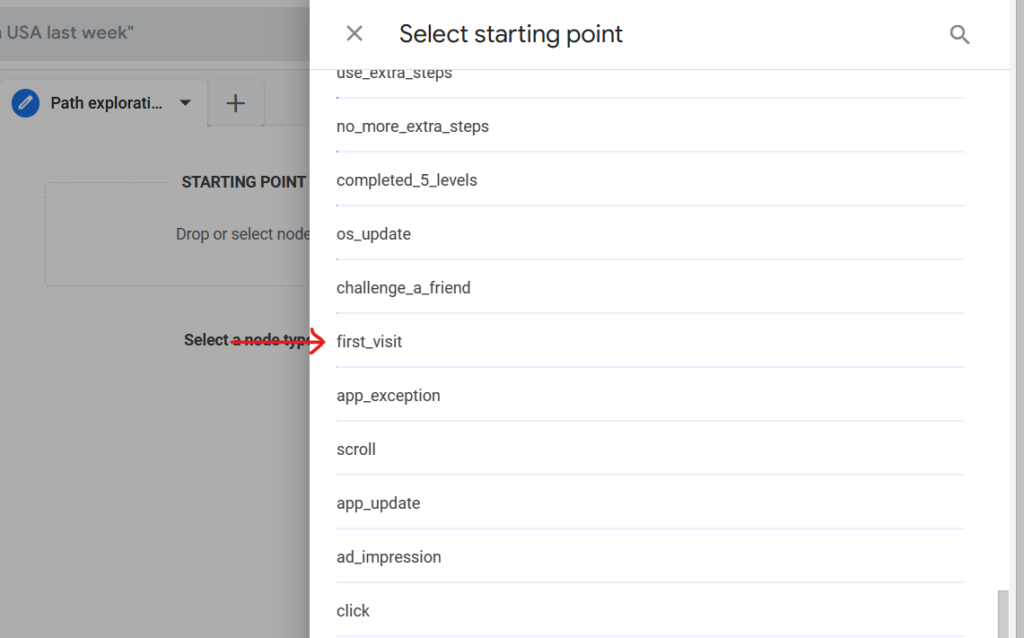
Step 8. Once you select the Event node, an overlay will appear from the right side of the screen. Here, you can pick the events for your path exploration, like session_start, scroll, first_visit, purchase, etc. Let’s go with the first_visit event for this report.
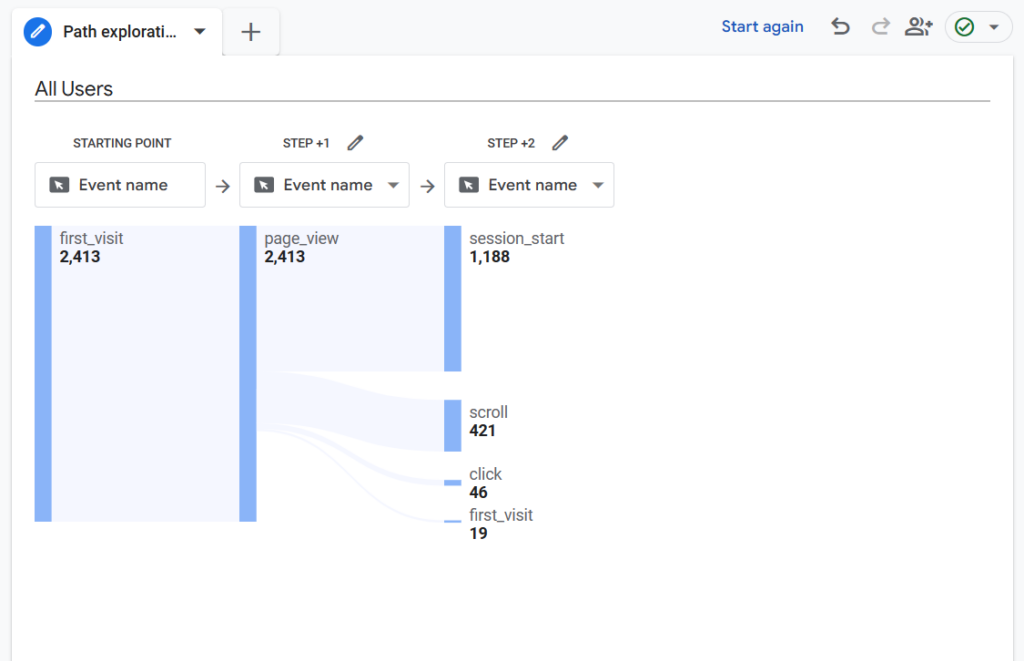
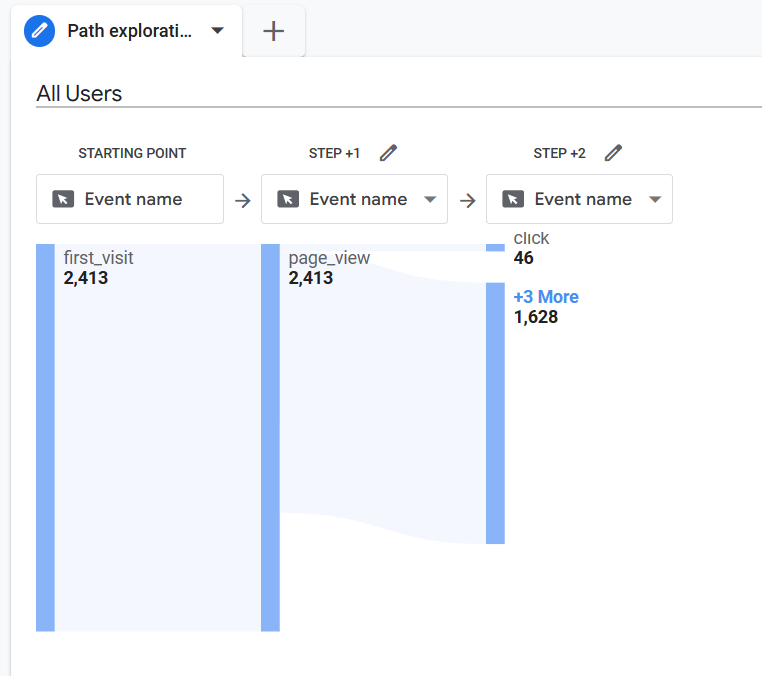
You can see that we have 2,413 first_visit events with subsequent page_view events in the second step. Click the Step+1 column, i.e., page_view, and you’ll see a new Step+2 added with subsequent event names like session_start, scroll, click, etc.
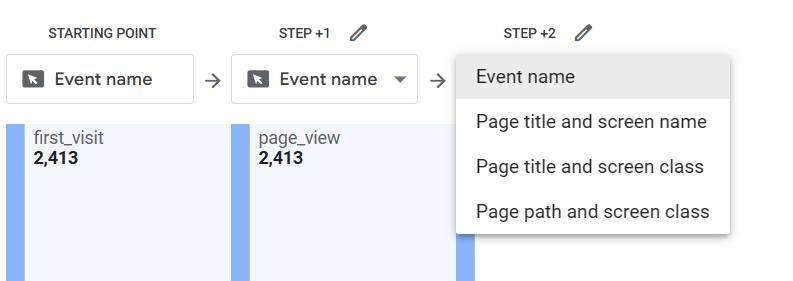
Step 9. You can select different nodes for each step. Simply click the drop-down menu for the desired step and pick the desired node. Selecting any of the three nodes, other than the event name, will show the page title and screen name/class in the subsequent steps instead of the event names.
Step 10. As you can see, subsequent steps after the starting point have multiple events. We can also highlight any one event and group the remaining events for easier analysis. Click the Pen icon next to the desired step and uncheck the events you wish to group.
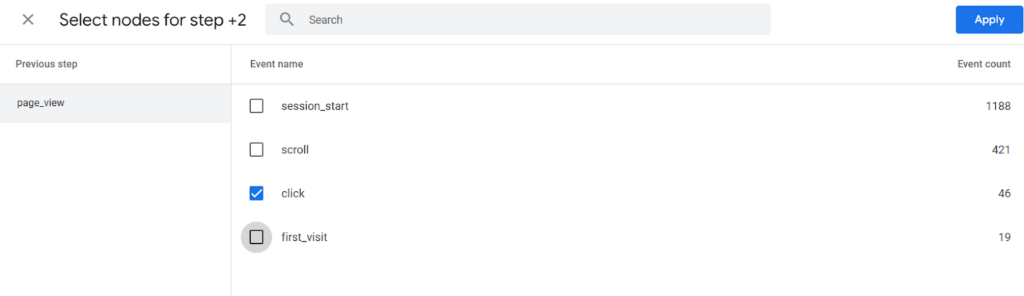
For Step+2, we have unchecked every event except the click event. Click Apply, and you can see that the click event has been highlighted in Step+2, and the rest of the events have been grouped together.
That was a forward-moving path exploration report that shows the next steps in the path after users trigger the events and visit the page selected as the starting point. We can also create a backward-moving path exploration report that tracks steps before a specified event or page name.
Creating a Backward-Moving Path Exploration Report in GA4
Simply click the Start Again button above the path exploration report and follow the steps as shown below:
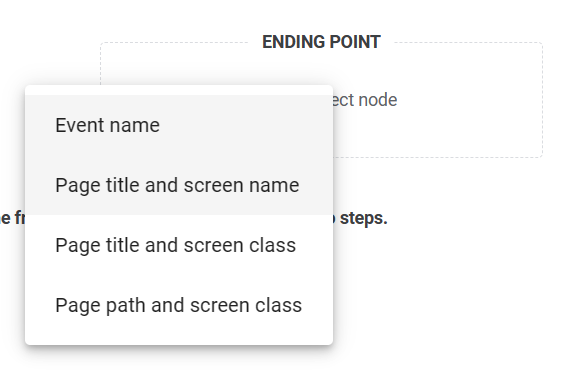
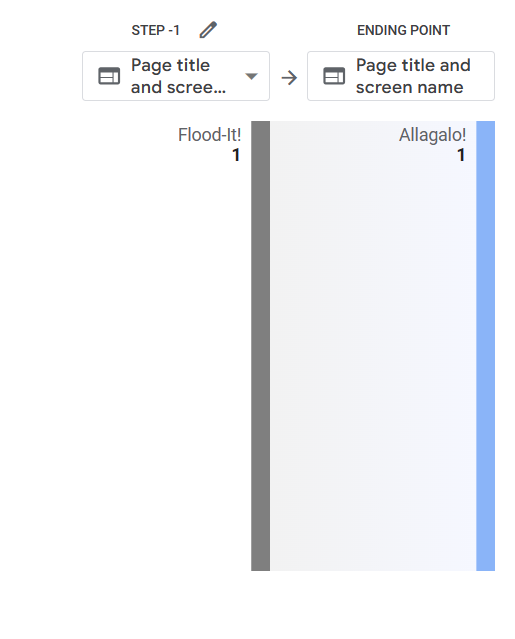
Step 1. For a backward-moving path exploration, select a node as the ending point. We have chosen the page title and screen name as the ending point.
Step 2. Once you select the page title and screen name node as the ending point, you must pick a page from your website from the pop-up menu.
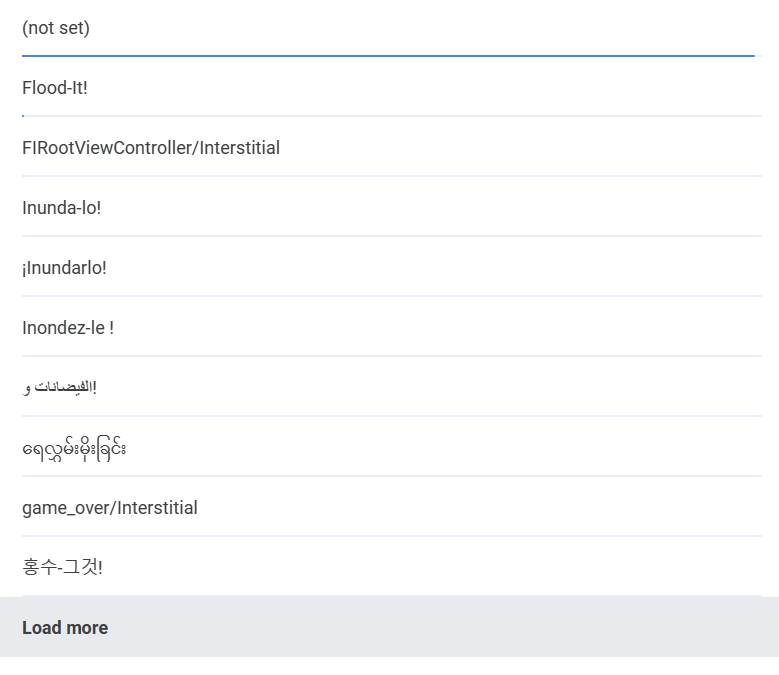
You will see columns as Step-1, Step-2, and so on before the ending point, as shown below.
Step 3. Just like the forward-moving path exploration report, you can select different events or any other node for each preceding node for your backward-moving path exploration.
Modifying Settings for Path Explorations
We can dig deeper into our path explorations using toggles and options in the Settings tab. Some available options are:
1. Breakdown Option
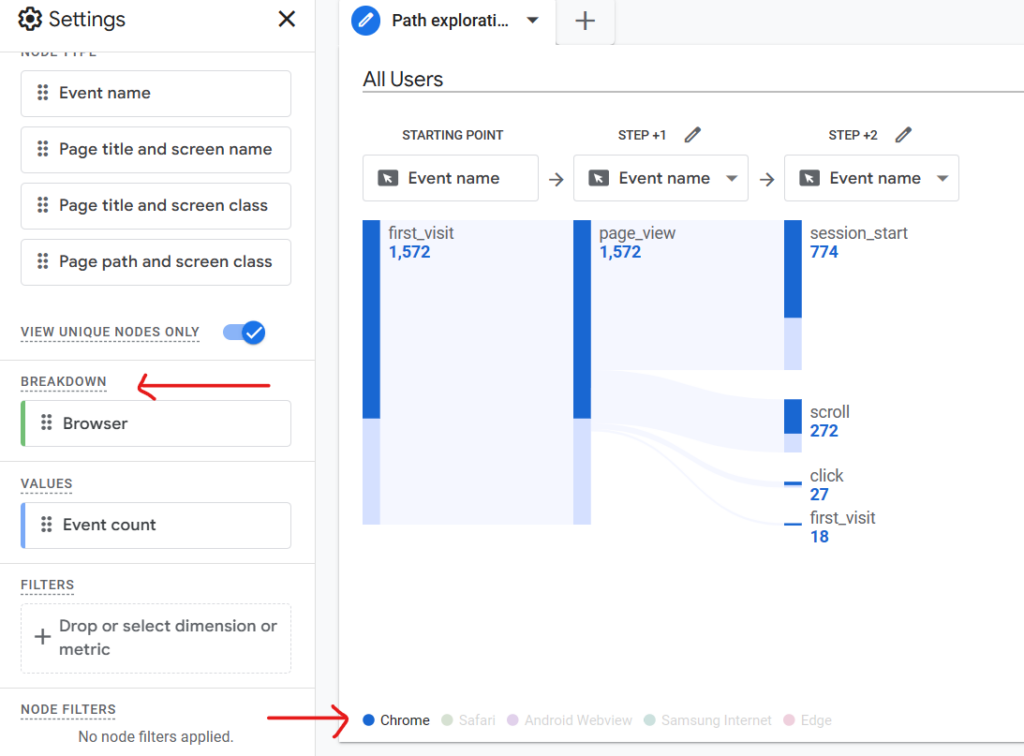
The Breakdown option in the Settings tab allows you to apply dimensions to your path exploration. Dimensions such as device, gender, country, etc., add an extra layer of information to your exploration.
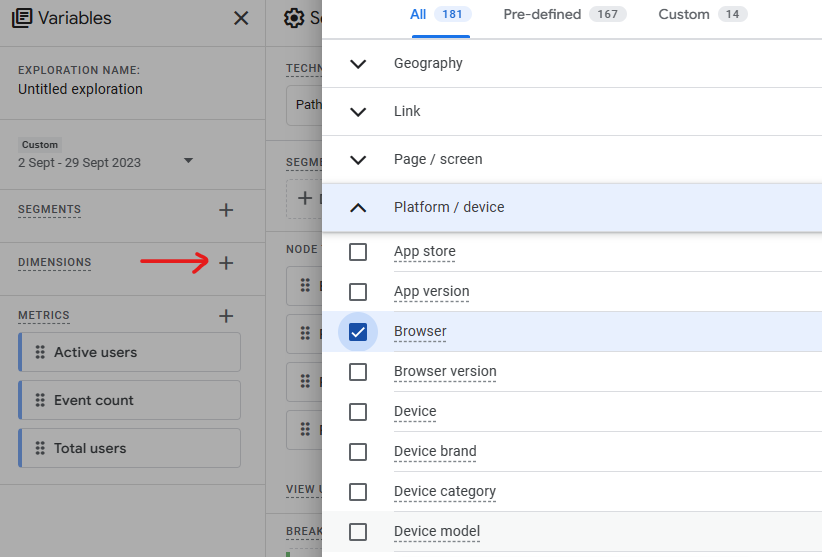
To add a dimension, you first have to pick Dimensions in the Variables tab. Simply, click the + icon in front of Dimensions options, pick desired dimensions from the list, and click the Import button at the top-right corner. Then, you can add dimensions in the Breakdown option.
Here, we have added a Browser as a dimension. It adds interactive options (browser names) at the bottom of the report. Hovering your mouse over a given browser name will show you events triggered or pages accessed from that specific browser.
2. Filters Option
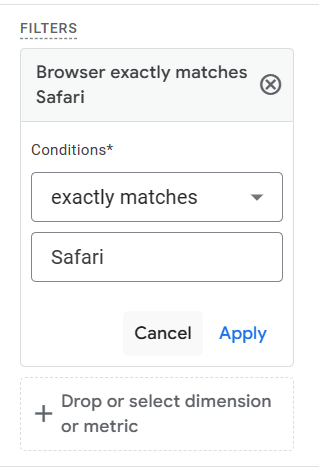
You can also use filters if you want to filter out excess information from your reports. Flters allow you to pick a dimension or a metric, which then filters and shows data for the dimension/metric you select. You can also specify a condition for your filter like equals, greater than, or less than, etc.
3. Segments in Path Exploration
You can also create segments. Segments let you create a subset of events or users to include or exclude from path exploration.
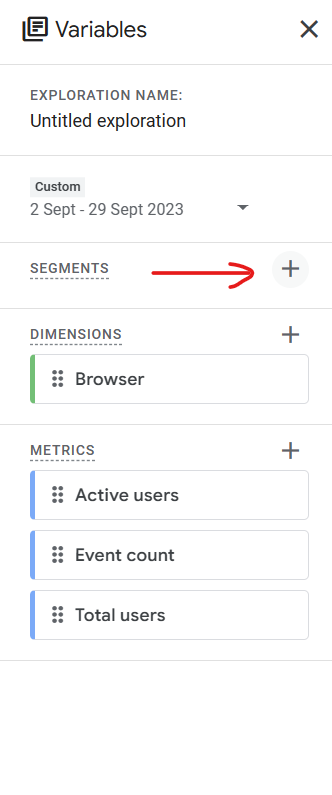
To add a segment to your report, first add a segment in the Variables tab. You can pick prebuilt segments or add custom ones as well. Then, you can add segments to your reports from the Settings tab.
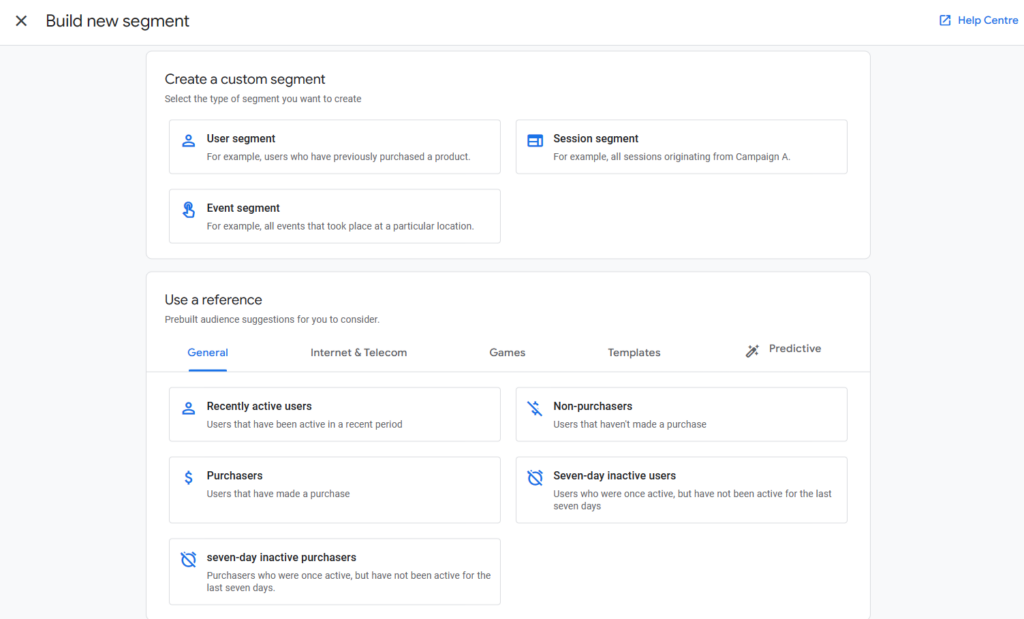
Suppose we want to know segment traffic by visitor’s geographic location, especially the country. We will select the User segment option, pick dimension as Geography > Country, use the “exactly matches” condition and select the desired country name. Click Apply and Save the segment.
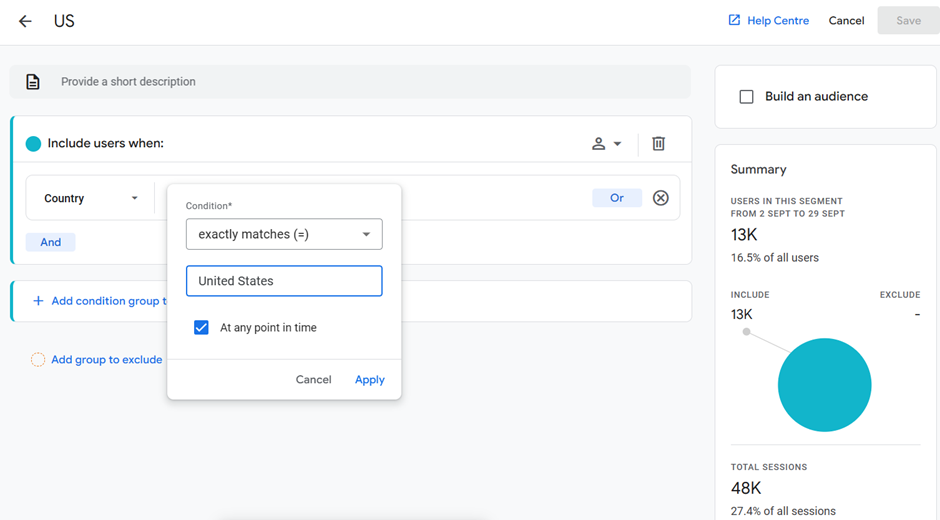
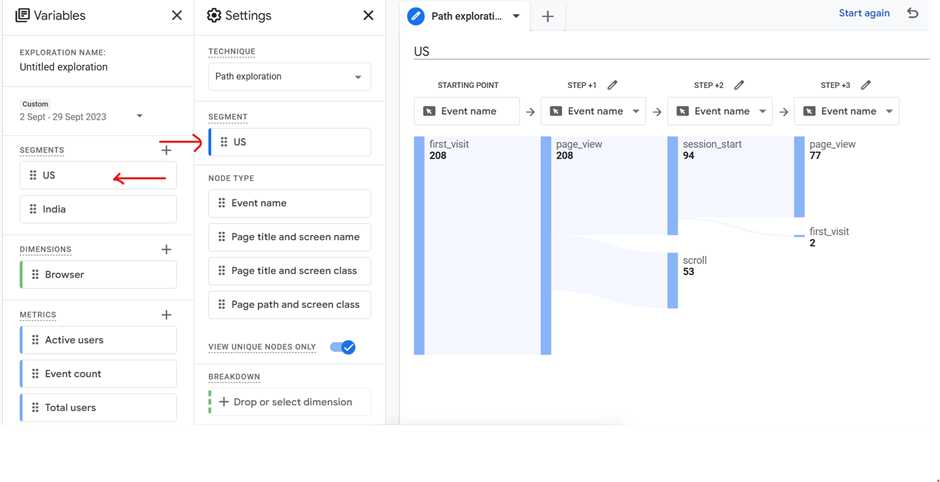
The newly created segment will be added to the Segments section in the Variables tab. Simply drag and drop it into the Segment section in the Settings tab, and your path exploration will display data for the US audience.
Additional Read: Learn to Use Standard Reports of GA4
Final Takeaway
That wraps this guide on the path exploration report in GA4. Path explorations give you valuable insights into user behavior on your website. You can pick an event or page name and then track steps users take to accomplish the selected nodes.
As a result, this report allows you to understand how users navigate your website and interact with its content. It also reveals any issues with your website that cause users to bounce off it. So, you can improve your site structure and its overall user experience.
Bonus Read: How EasyInsights works with Raw GA4 Data for Data Activation and Enrichment
EasyInsights works with raw GA4 data for data activation and data enrichment in a few key ways:
Data Collection and Transformation:
- EasyInsights connect directly to your Google Analytics 4 property allowing it to access and extract the raw GA4 data you’ve collected.
- Data Transformation: EasyInsights then cleans, normalizes, and enriches the data to make it usable for activation purposes. This may involve tasks like:
- Formatting data: Ensuring all data points are in a consistent format.
- Handling missing values: Filling in missing data points or removing them according to your preferences.
- Enriching data: Adding additional data points from other sources to create a more comprehensive picture of your customers.
Data Activation:
- Segmentation and Targeting: It allows you to segment your audience based on various criteria like demographics, behavior, and interests using the enriched GA4 data.
- Multi-channel Marketing: You can then use these segments to activate your audience across different marketing channels like email, social media, and advertising platforms.
- Customer Relationship Management (CRM): The data can be used to personalize outreach and interactions with customers within your CRM system.
- Marketing Attribution: EasyInsights can help you understand how different marketing channels contribute to conversions and optimize your marketing spend accordingly.
Key Feature:
- Offers features like customer data platform (CDP) capabilities, marketing automation, and campaign management tools.
- Focuses on reverse ETL (extracting data from your warehouse and sending it to marketing tools) and offers pre-built integrations with various marketing platforms.
EasyInsights is a marketer’s preferred tool for first party data activation.
In this age of cross-channel marketing, EasyInsights offers a comprehensive platform to collect, store, and transform all your first-party data.
EasyInsights enhances marketing campaign efficiency in a cookieless landscape with accurate ad signals. It helps brands step away from surface-level metrics and unleash the potential of first-party data to optimize marketing strategies, ensuring a superior Return on Ad Spend (ROAS). It does all this, while being a highly affordable no-code platform with an exceptional customer support apparatus.
Sign up for a demo today to see EasyInsights in action.