Did you migrate to Google Analytics 4 (GA4) property recently? You are not alone if you cannot find Views in GA4. With the new event-based data model, GA4 has shifted the focus from sessions analytics to audience-focused analytics. Consequently, reporting in GA4 is entirely different, and popular features like Views from Universal Analytics (UA) are no longer available.
In this blog, we explore in this blog the state of views in Google Analytics and how to create views in GA4.
Jump ahead to:
Why Google Analytics 4 Does Not Have Views
Due to rising privacy concerns related to cookies and higher penetration of mobile users, Google Analytics version 4 introduced the new event-based data model. As a result, views are no longer available as they were in Universal Analytics. Instead, you get data filters to distinguish your internal traffic.
Another reason why Google removed views is that they often proved dysfunctional for users. For instance, views do not register hits that occur before when users add inclusion criteria. So, processed data is incomplete and inaccurate.
What are Views in Universal Analytics
Universal Analytics allows users to create up to 25 views for each property. The views helped users filter traffic from a particular domain. It is common for analysts and website owners to create views that filter internal traffic, traffic from specific sources, etc. You can access views in Admin settings. UA’s Admin settings hierarchy looks like this:
Account > Property > View
- Account settings are available in the left column and contain settings for the overall organization.
- Property settings are available in the center and provide a unique tracking code and settings for different web properties, including website and mobile apps.
- View settings are on the right side and have all your data and reports. You can also set goals and conversions for every view that you create. You also get options like content grouping, filters, segments, and more.

It is considered a best practice to keep the following views in UA:
- Master view for daily reporting.
- Unfiltered view for raw data.
- Test view for trying new configurations and new filters.
What Replaces Views in Google Analytics 4
Although the hierarchy in the Admin section in GA4 remains somewhat similar to UA, now you get Data Stream instead of View.
Account > Property > Data Stream
But when you head to the Admin section, you will only see columns for Account and Property.
- Account settings are settings for the overall organization.
- Property settings contain options for your website or an app. You can now combine app and website data in a single property and create a unified view of traffic across both a website and an app.
- Data streams is a section under Property settings that provides options to replicate View from Universal Analytics in GA4.

Additional Read: New Things That Can Be Done via Google Analytics 4
What are Data Stream in Google Analytics 4
A data stream is the source of data for your Google Analytics property. Whether you want to collect data from the website or mobile app, you must set it up in the data stream section under the Property level of Admin section. GA4 allows users to set up three types of data streams:
- Website
- Android App
- iOS App

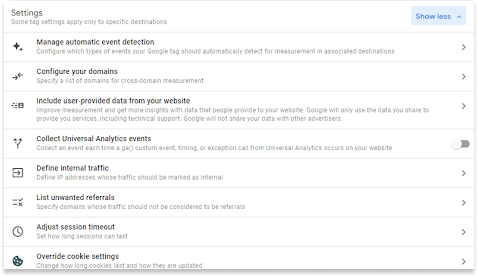
The data stream section also provides settings for each data source so you can control how data is displayed. But you will not find View or a similar option here. You only get the Define internal traffic option which allows you to restrict internal traffic from your GA4 reports.
Creating a View in Google Analytics 4
Even though you do not get Views in GA4, you can use standard GA4 reports and filters to create something similar to Universal Analytics’ View option. To do that, head to the navigation bar on the left side of your screen and click on the Reports section. You will see options like Realtime reports, Life cycle reports, etc.
Now, expand the Life cycle reports section and then select Engagement reports. The Engagement reports section has two reports – Overview and Events. And all reports you create that have filters appear below them.
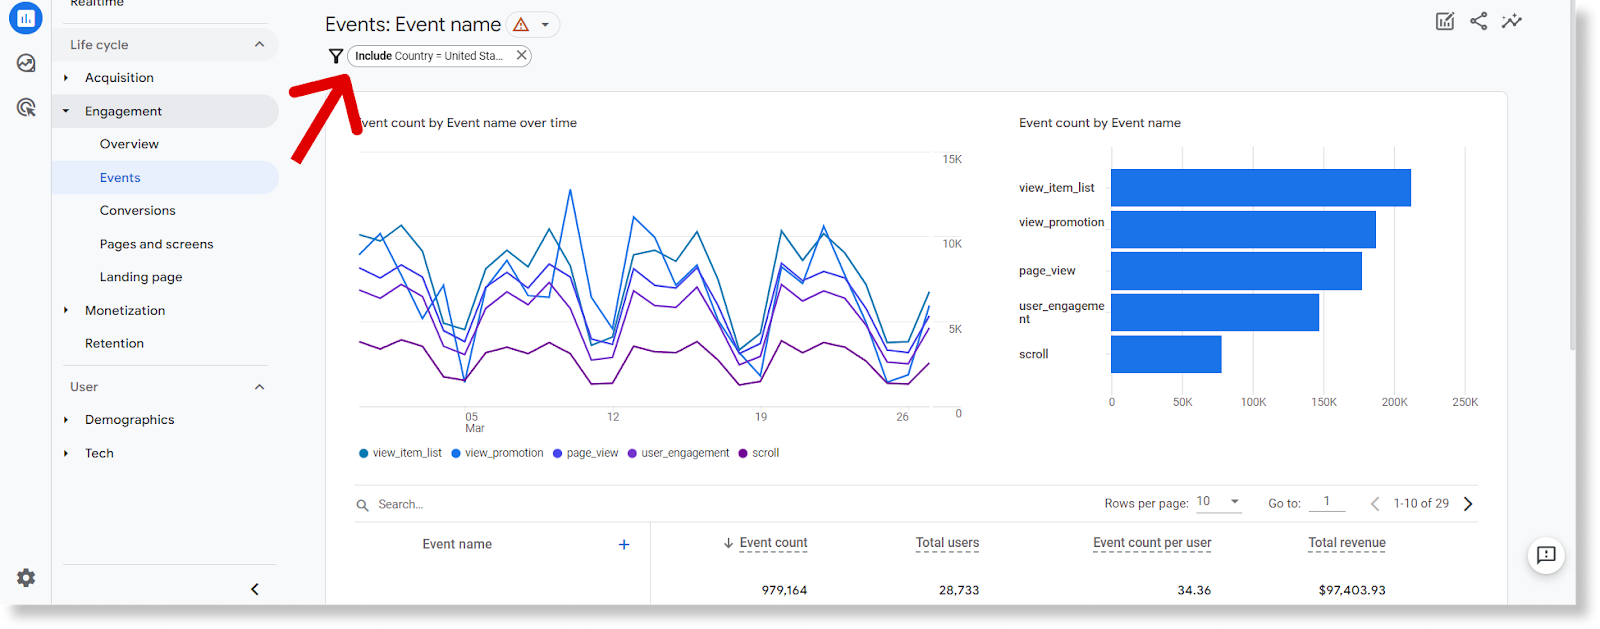
For instance, let us create a view to filter our website traffic that comes only from the United States.
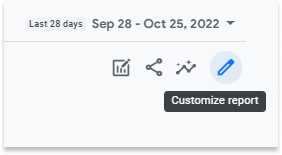
- First, we will open the default Events report and click on Customize report option displayed as a pencil icon in the top-right portion of your screen.
- Clicking on the Customize report option will bring up several dimensions which you can use to filter data. Since we want to see traffic data coming from the US, we will select the dimension as Country and set the condition as the United States. Apart from the country, you can use dimensions like demographics, platform/device, campaign, users, video title, and more.

- Save this report as a new report, and then you can access it in the GA4.
Here is what our report for US traffic looks like:
You can also create your own collection of custom reports for quick access. Just click the Edit collection button and move your new custom report to a preferred place in your collection.

Some Other GA4 Reporting Features You Should Use
Even with custom reports and dimensions, reporting in GA4 is vastly different and misses out on some key features from UA. But it does not limit your reporting, given you know your way around GA4 and its features. The new event-based data model has brought many new reporting features to help you with your traffic analysis. Here are some GA4 reporting features that you should know about:
- Event Parameters
Unlike Universal Analytics’ session tracking, GA4 tracks every hit/conversion as an event. Event parameters allow you to add context to every event you track. This makes your reporting data richer and offers a clearer picture of website traffic and its sources.
GA4 offers two event parameter types – automatically collected and custom events. You can create custom text event parameters and use them as dimensions, while numerical custom parameters are used as metrics.
- Path Exploration
Google Analytics 4’s path Exploration report is similar to UA’s Behavior Flow report but allows you to track traffic using starting and ending points. The new report is available under Explore section in GA4.
- UTM Tagging
Suppose you have several email marketing campaigns. You have no way to see how many visits you get from links you have shared via email since GA4 classifies all traffic as “direct.” This is where UTM tagging becomes essential. UTM tags are code snippets you can add to links you share so GA4 can attribute incoming traffic to that source.
Additional Read: A Comprehensive Guide for UTM Tagging – Google Analytics
- Site Search Tracking
Site search is one of the many Enhanced Measurements available in GA4. When enabled, GA4 will automatically track the terms that visitors search on your website. You can enable Site search enhanced measurement in the Data Stream section under Property settings.
Final Words
Even though Google has done away with Universal Analytics’ views in GA4, there are countless new reports with new dimensions and parameters. You can also create custom reports and events for easier website traffic analysis. So, if you plan to utilize GA4 to its full potential, you must be well aware of all the features the platform offers.
Found this blog to be helpful? Check out more blogs and guides on the EasyInsights blog. EasyInsights is a next-gen data analytics platform that allows you to collect data from 50+ popular data sources, harmonize and transform data, and export it to BI tools of your choice. Visit our website to request a free demo.