More than 4.5 billion users are actively using Google search and different social media platforms. That is why over 75% of marketers use PPC ads to boost brand awareness. But posting an ad on Google or Facebook is not always a guarantee of success. PPC advertising requires active monitoring, optimization, and data-backed decision-making to get the best results from your paid campaigns. That is why PPC reporting is a marketer’s best friend.
In this blog we will understand what PPC reporting is and how to create a PPC report. We will also walk you through some tips to do PPC reporting the right way. Read on.
Jump ahead to:
What Is a PPC Report?
PPC report is a performance report of your paid ad campaigns that help you measure the effectiveness of your marketing strategy. It includes performance data, insights, and a summary of all your search engine and social media ad campaigns and other sponsored links.
A PPC report includes tracking and measuring key performance indicators (KPIs) such as click-through rate (CTR), cost-per-click (CPC), conversion rate, return on ad spend (ROAS), and others, depending upon the intent of your campaign.
PPC reporting tells a marketer what works and what does not so they can improve their marketing efforts. With data-backed insights from a PPC report, you can modify your current campaigns for better results and use the learnings for future campaigns.
But what is more important to note is that PPC reports help you understand whether your current paid campaigns generate profitable ROI. You can clearly see which campaigns do better than others and determine your budget allocation for better results.
In short, PPC reporting helps marketers track their ad campaigns across different platforms. At the same time, it allows them to manage these campaigns and provide data to help optimize them to reach a bigger audience.
Additional Read : How to Name Marketing Campaigns for Structured Analytics
The Best Way to Create PPC Reports
Here are the steps you can follow to create detailed PPC reports:
Determine Your Marketing Goals and KPIs
KPIs are the most important element of any report, and that also goes for PPC reporting. They help you assess if your strategies were a success. But it is better to set clear marketing goals before you can select KPIs to track. So first, decide which marketing goals your ad campaigns should try and achieve.
It is crucial to set clear and measurable goals. For instance, if your goal is to generate leads, you can track KPIs like lead volume, lead quality, and cost per lead. Similarly, if you only want more visitors, impressions, bounce rate, and click-through rate (CTR) are some KPIs for PPC reports.
Since your PPC campaigns target audiences at different stages in their customer journey, you must also consider KPIs according to their relevance to the user journey stages. For example – At the awareness stage, when creating brand awareness, you can focus on engagement metrics like impressions, reach, bounce rate, session duration, etc. However, for a customer at the decision stage, you may want to track conversions, transactions, CPC, ROAS, etc.
Collect and Analyze Data
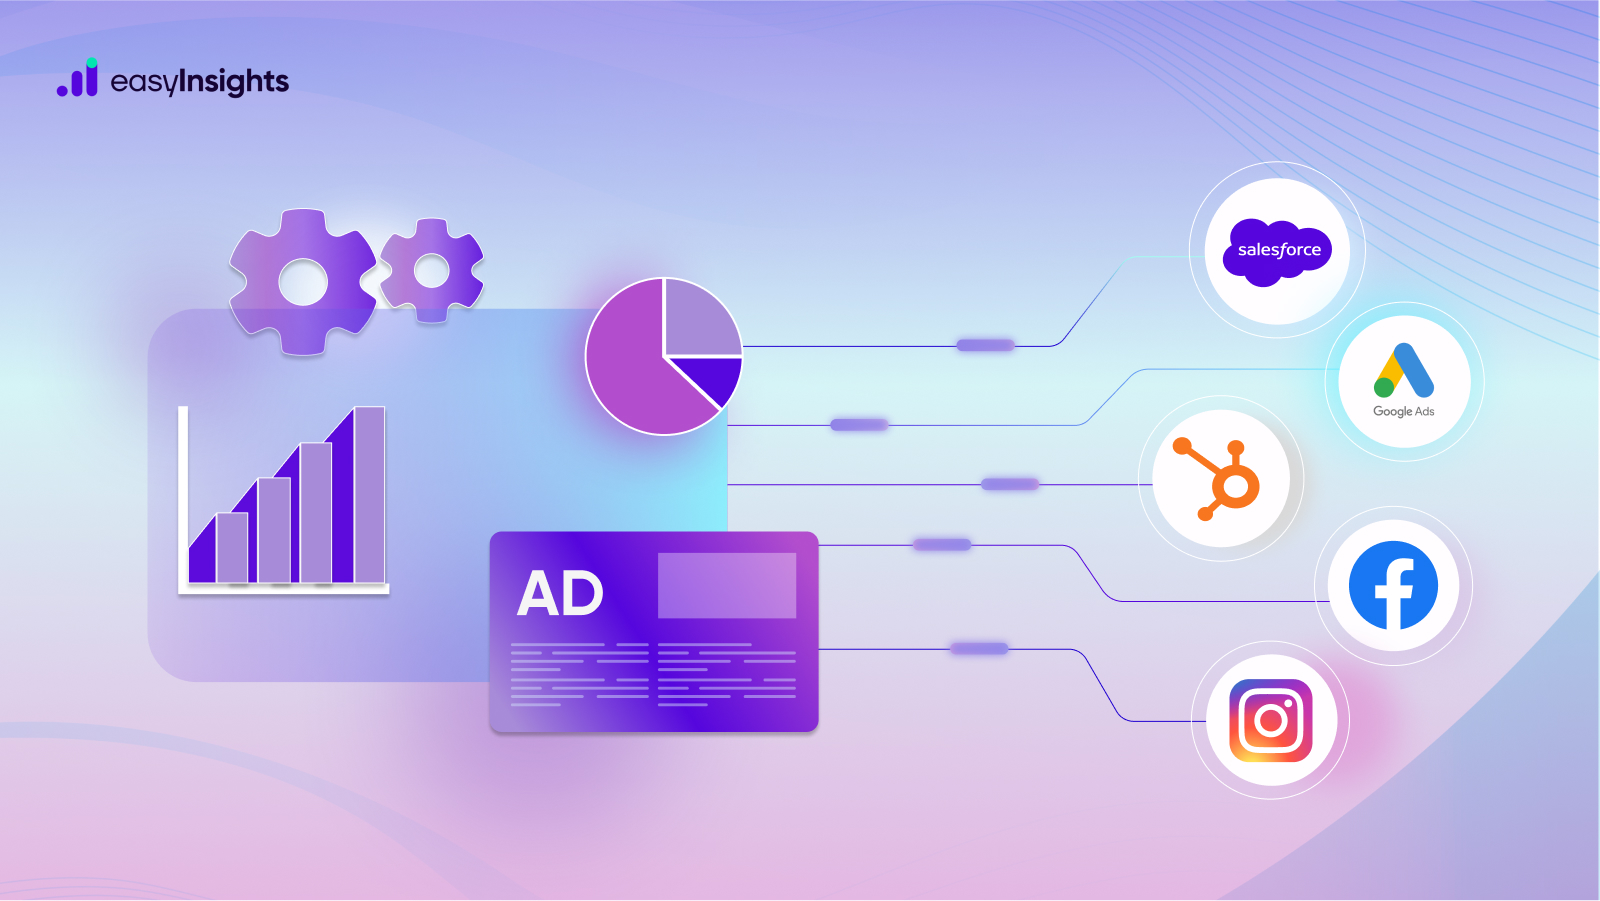
Once you have set end goals for your ad campaigns and decided on KPIs to track for PPC reporting, you must collect marketing data for analysis. Use PPC platforms like Google Ads, Bing Ads, Facebook Ads, and others to track the performance of your campaigns in real time. These platforms will give you all relevant data related to different KPIs, which you can use to create PPC reports in BI tools.
After gathering data, you can evaluate it to identify trends. Examine your data for patterns, such as which ad groups or keywords are doing well and which are not. This will assist you in identifying areas for improvement and optimizing your campaigns for improved results.
What Should be Included in a PPC Report?
Now that you have your marketing data, you can use it to create PPC reports. You must divide the report into different sections for easy perusal. Here is a breakdown of sections you can have in your PPC report
Decide the Intent of the Report
Before creating a report, decide which customer journey stage you want to track. The customer journey stage of your PPC reporting will help you determine which KPIs should be included in your report.
For instance, if you are tracking user interaction in the brand awareness stage, your report must include KPIs like impressions, cost per click, CTR, etc. However, for users in the decision stage, your PPC report must track conversion rate, customer lifetime value, cost per acquisition, etc.
Definitions
There may be many technical and non-technical users of your report. So it is essential to mention all the technical terms, KPIs, and data and explain them in plain language. It will ensure that your PPC reporting is easy to understand.
Summary
The summary gives an overview of the report’s most relevant facts, such as the overall campaign performance, appreciable changes from the last report, and any measures put in place to optimize the campaign.
Data and Insights
This is where you will add data about all KPIs you measure. Use visualizations and dashboards so it is easier to interpret data and draw conclusions. Depending on your needs, you can segment your PPC report into different sub-sections, such as audience analysis, campaign performance analysis, spend analysis, etc.
Future Course of Action
This section outlines actions to optimize the campaign based on insights and recommendations from the report, such as ad copy and creative changes, keyword optimizations, and budget adjustments.
Things to Keep in Mind When Creating PPC Reports
You must keep several things in mind when creating a PPC report to create accurate and informative PPC reports. But first, you must know what all types of reports you must prepare. For instance, an online business must run these three PPC:
- Search Engine PPC
- Social Media PPC
- E-Commerce PPC
So let us look at some tips to help you with PPC reporting for these mediums:
Search Engine PPC Reporting
Whether you use Google Ads or Bing Ads, the PPC reporting process is similar. But let us look specifically at Google Ads PPC reporting as it is the most widely used ad platform. Here are some things to remember:
A. Finalize KPIs
Do not limit your performance evaluation and PPC reporting to a handful of KPIs. Instead, include an analysis of keywords, different campaigns, and ads.
B. Use Historical Data for Comparative Reporting
PPC reporting is not a one-time exercise, so also consider historical data for your reports. For instance, you can benchmark KPIs with previous data to see if your campaign’s performance is improving or worsening.
C. Compare Different Campaigns
Measure KPIs for all your ad campaigns and compare them to see which campaigns perform better. Also, look for ads and keywords that do better and recreate them in new campaigns.
Social Media PPC Reporting
No matter the business, social media is the perfect opportunity to get in front of possible customers. So, in addition to search engine ads, social media campaigns will also be a huge part of your PPC reporting. Just follow these tips:
A. Move Beyond General KPIs
One of the most important things regarding PPC reporting for social media ad campaigns is to look past general KPIs such as likes, comments, etc. To measure success accurately, analyze which posts get more engagement and at what time or day users engage with your ads the most.
Also, when you measure performance metrics, try to extract insights from the data. For instance, if your CTR increases, try to find changes you may have made that caused the spike.
Additional Read : 11 Important Social Media Metrics To Track ROI for Your Client
B. Use Historical Data to Benchmark Current Results
Like search engine PPC reporting, compare your KPIs with previous data to benchmark your progress. Also, use social media analytics tools to identify characteristics of your audience to optimize your campaigns for better targeting.
C. Schedule Regular Reports
Social media is a volatile platform, and trends can change by the day. So, schedule your reports bi-weekly, weekly, or monthly to remain on top of the changes. This way, you can monitor your progress and make necessary changes in time to improve results.
E-Commerce PPC Reporting
If you are listed on an e-commerce site like Amazon and also run ads on the platform, you must also do e-commerce PPC reporting in addition to the search engine and social media reporting. Here is how to do e-commerce reporting:
A. Set the Right Goals
E-Commerce platforms such as Amazon provide several reports, including keywords report, search term reports, sponsored product reports, etc. That gives you access to a plethora of KPIs but can also make the entire reporting process complex. So, keep your goals in mind to measure relevant data without wasting resources.
B. Segment Your PPC Data
To analyze your PPC data, segment it by campaign, keywords, and ad groups. Segmentation makes it easier for you to distinguish better-performing ads, campaigns, and keywords from those that need more optimization.
C. Use E-Commerce Analytics Tools
To optimize your e-commerce PPC reporting workflow for efficiency, you should use analytics tools tailored for e-commerce reporting tasks like keyword research, product research, listing optimization, sales tracking, etc. Here are some popular Amazon PPC reporting tools:
Final Words
PPC reporting is a vital marketing exercise if you plan to grow your brand through paid ad campaigns on digital platforms. With PPC reports, you can measure your performance and make better decisions. In addition, reporting helps you discover trends, identify room for improvement, and grow your business.
Before you begin with search engine and social media ad campaigns, ensure you have all the necessary analytics tools. Instead of working in silos, bring all your marketing data to one place using EasyInsights. We created EasyInsights to help marketers work with cross-platform interconnected data. You can automate data collection from different sources, harmonize it in EasyInsights, and ship it to any BI tool for visualization.
Visit the EasyInsight website for more information and request a free demo


