With Google Analytics 4, Google has changed how marketers and website owners track user behavior and traffic. Users today are more conscious about their privacy when using websites and mobile apps. So, Google has introduced a new event-based data modeling with GA4 that reduces reliance on cookie tracking to measure users’ journey on your website who are increasingly placing value on their privacy. But that does not limit your analysis. Instead, you get new metrics and dimensions to create custom and more detailed GA4 reports.
Let us walk you through different standard reports available in Google Analytics 4. This blog will also cover how standard GA4 reports differ from Universal Analytics reports and how to access them.
Jump ahead to:
Introduction to Reporting in Google Analytics 4
Similar to Universal Analytics (UA), standard GA4 reports are a set of pre-built reports comprising data and visualizations to help marketers and website owners identify trends in their website’s traffic. You can also create custom reports using GA4’s new metrics and dimensions for in-depth analysis.
But Universal Analytics users shifting to GA4 will quickly notice that reporting is very different on the two platforms. In UA, you got more than 30 standard reports grouped into the following categories:
- User
- Engagement
- Acquisition
- Monetization
Whereas GA4 divides reports into two categories – Standard Reports and Explorations. Also, with the introduction of a new event-based data model in GA4, reports based on metrics like sessions and pageviews are no longer available. What you get instead are around 15 reports as standard reports divided into the following report collections:
- Reports snapshot
- Realtime report
- Life cycle reports
- User reports
- App Developer Collection Reports
As for Explorations, Google defines them as “a collection of advanced techniques that go beyond standard reports to gain deeper insights about user’s behavior. However, for this piece we will focus on standard reports.
Additional Read: A Swift Movement from Universal Analytics to Google Analytics 4
Accessing Standard GA4 Reports
To navigate to standard reports in GA4, head over to the navigation menu on the left side of your screen, right below the Home icon, click on the Reports icon, and there you have all your pre-built reports arranged into different collections.
Exploring Standard GA4 Reports
Let us go over all the categories of standard GA4 reports.
Reports Snapshot
When you access GA4 reports from the navigation menu, the First section of standard reports is the Report Snapshot. It is a collection of different reports arranged in the form of widgets. It lacks deep insight as it is solely meant to give you a quick overview of your website traffic. The snapshot section shows details like users, new users, average engagement time, total revenue, and more.
Realtime Reports
The Realtime Report in GA4 is similar to the one in Universal Analytics. It provides insights into your website traffic for the last 30 minutes and includes details like user count, source, page views, and events.
However, the Realtime Report in GA4 gets more interactive visuals for diving deeper into data using widgets like event triggers. Apart from that, you also get a map to see the location of your visitors and the share of traffic between desktop and mobile users.
Life Cycle Reports
The Life Cycle Reports collection comprises the most crucial standard GA4 reports – the Acquisition, Engagement, Monetization, and Retention reports. Lifecycle reports help you track a user’s journey on a website by breaking down their interactions into different stages of the user lifecycle. Let us see each report one by one.
1. Acquisition Reports
Acquisition reports help you understand how you acquire visitors and include data on channels, sources, and mediums that drove traffic to a website or app. The reports has following sub-sections: Acquisition Overview, User Acquisition, and Traffic Acquisition.
Overview
Acquisition Overview provides a summarized snapshot of users and sessions. You can also integrate platforms like Google Ads with GA4 to see their data in Acquisition Overview.
User Acquisition
User Acquisition reports help you identify where new users come from, what campaigns bring new users, and which channels drive more traffic.
Traffic Acquisition
Traffic Acquisition reports help you identify where new sessions come from and what campaigns bring those sessions. While User Acquisition focuses only on new users, Traffic Acquisition also considers data for returning users.
2. Engagement Reports
Engagement reports help you understand how visitors interact with your website or app and its content. Engagement reports include Overview, Events, Conversions, and Pages and Screens sections.
Overview
The section provides an overview of user engagement on a website, including data on sessions, page views, and other user interactions.
Events
Events report shows details like – actions that users perform, most common actions, revenue associated with every event, etc.
Conversions
When you classify events or actions performed by users as conversions, they appear in the Conversion report.
Pages and Screens
Pages and Screens report shows how visitors interact with the most popular pages on your website. This GA4 report is similar to the All Pages report present in Universal Analytics.
3. Monetization Reports
You will find most valuable insights in Monetization reports if you sell products online. You can track purchases users make via your websites and apps.
Monetization Overview
The monetization overview shows details like total revenue, total purchases, etc., for perusal at a glance.
E-commerce Purchases
The E-commerce purchases report shows details about the products you sell on your e-commerce website. The report shows data like sales, first-time customers, revenue, etc.
In-app Purchases
The In-app purchases report shows details about the purchases users make in your mobile app. You can see data about sales, revenue, popular feature or content, etc.
Publisher Ads
If you have monetized your web traffic using ads, you can track your ad revenue data in Publisher ads. The report shows engagement and revenue data associated with each ad you place on your website or mobile app.
4. Retention Report
The next Life Cycle GA report, the Retention report, helps you understand how often users return to your website after their first visit. The Retention report contains graphs to analyze metrics like user retention, engagement, lifetime value, and more. You can also see a chart showing metrics by cohorts, i.e., collection users grouped by some criteria.
Cohort analysis helps you understand how user behavior changes over time. Here are examples of cohorts available in GA4:
- Users acquired on the same day
- Percentage of users returned to your site on the second and eighth days
- Amount of time these users spent on the site
- Percentage of visitors who accessed your site on consecutive days over a certain period
- Time-averaged engagement
User Reports
The last standard GA4 reports are User reports, and it includes two reports – A demographics report and a Tech report.
Demographic GA4 Reports
This GA4 report has two sections – Demographic overview and Demographic details.
Demographic details help you analyze user behavior based on country, city, region, language, gender, and age. You can track data for each dimension using metrics like users, new users, engaged sessions, engagement rate, event count, etc.
You can change primary dimensions and add secondary dimensions to get deeper insights into the demographic data of your traffic. Like other reports, the Demographic overview shows data for multiple dimensions using reports arranged as cards.
Tech GA4 Reports
If you want to know what technology is driving traffic to your website, the Tech report is the place to go. The Tech GA4 report also has two sections – Overview and Tech details.
Tech details help you track metrics based on dimensions like device category, device type, browser, screen resolution, operating system, and more. And Tech overview shows data in the form of snapshots.
Like Demographic details, you can change the primary dimension and add secondary dimensions to data in Tech details to better understand users, engagement, and sessions.
Additional Read: Everything to Know About GA4’s New Metrics And Dimensions
5. App Developer Collection Reports
App developer collection reports are only available for websites that have connected mobile apps. These reports give a summary of data related to in-app user experience to help Android, and iOS app developers monitor the performance of their apps.
Games GA4 Report
The games report shows you data about how users use your mobile gaming apps. These reports help you understand how you acquire users, retain them, and generate revenue.
Firebase GA4 Report
Firebase is a software development kit developers use to create mobile and Web apps. If you have connected your app to Firebase, you can access data about users and their behavior in your app.
Bonus Read: How EasyInsights works with Raw GA4 Data for Data Activation and Enrichment
Even though Google Analytics 4’s new privacy-centric data model has reduced the number of standard reports compared to Universal Analytics, it offers more customizations to extract actionable insights from your website traffic data.
Google has designed GA4 as a data aggregation tool more than a visualization tool or an all-in-one analytics platform.
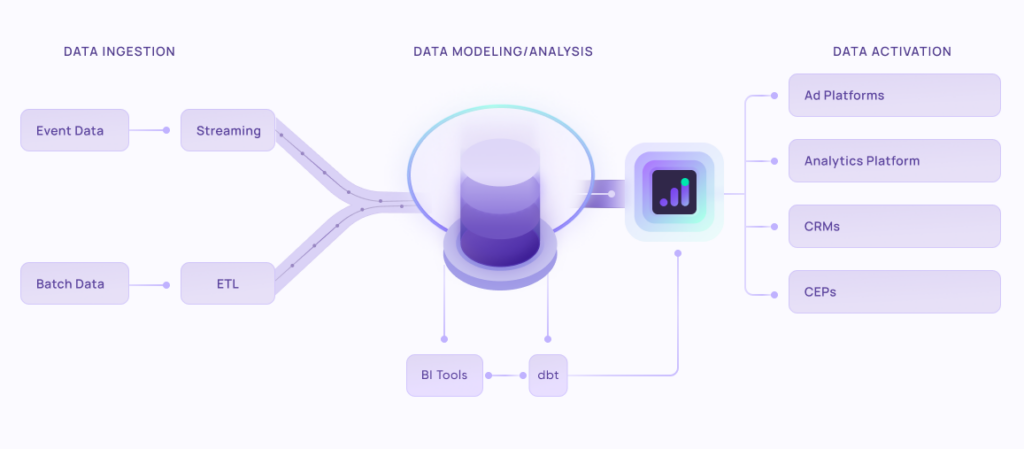
EasyInsights works with raw GA4 data for data activation and data enrichment in a few key ways:
Data Collection and Transformation:
- EasyInsights connect directly to your Google Analytics 4 property allowing it to access and extract the raw GA4 data you’ve collected.
- Data Transformation: EasyInsights then cleans, normalizes, and enriches the data to make it usable for activation purposes. This may involve tasks like:
- Formatting data: Ensuring all data points are in a consistent format.
- Handling missing values: Filling in missing data points or removing them according to your preferences.
- Enriching data: Adding additional data points from other sources to create a more comprehensive picture of your customers.
Data Activation:
- Segmentation and Targeting: It allows you to segment your audience based on various criteria like demographics, behavior, and interests using the enriched GA4 data.
- Multi-channel Marketing: You can then use these segments to activate your audience across different marketing channels like email, social media, and advertising platforms.
- Customer Relationship Management (CRM): The data can be used to personalize outreach and interactions with customers within your CRM system.
- Marketing Attribution: EasyInsights can help you understand how different marketing channels contribute to conversions and optimize your marketing spend accordingly.
Key Feature:
- Offers features like customer data platform (CDP) capabilities, marketing automation, and campaign management tools.
- Focuses on reverse ETL (extracting data from your warehouse and sending it to marketing tools) and offers pre-built integrations with various marketing platforms.
EasyInsights is a marketer’s preferred tool for first party data activation.
In this age of cross-channel marketing, EasyInsights offers a comprehensive platform to collect, store, and transform all your first-party data.
EasyInsights enhances marketing campaign efficiency in a cookieless landscape with accurate ad signals. It helps brands step away from surface-level metrics and unleash the potential of first-party data to optimize marketing strategies, ensuring a superior Return on Ad Spend (ROAS). It does all this, while being a highly affordable no-code platform with an exceptional customer support apparatus.
Sign up for a demo today to see EasyInsights in action.


