What is Data Stitching?
Today, data is the nucleus of all business decisions. Deriving meaningful information, insights from varied data sets help a business take actions based on concrete know-how about their customers.
In a digital world, your customers are everywhere and so is the data trail. Data stitching is the process of bringing data from different platforms, devices, and sources to a commonplace. The e-commerce data thus can be consolidated into a uniform template for easy consumption and analysis.
Click here to learn about “Data Stitching Explained: 3 Powerful Use Cases of Stitching Data at the User-Level”.
Data stitching helps marketing teams understand their customers’ persona, needs and engagement patterns better. With these tools, marketers can design meaningful campaigns based on solid insights and not just assumptions or theories.
Data stitching saves time and effort in combing through multiple data sets that lead to half-baked conclusions and ineffective marketing strategies.
Jump ahead to:
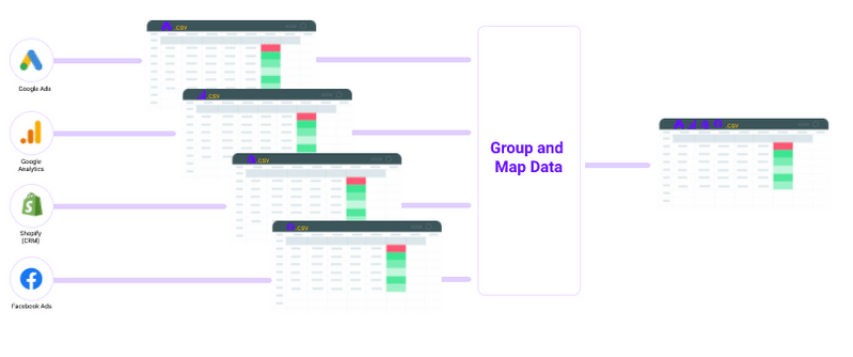
Multiple data sources can be stitched on common columns
There are two ways to do the same.
Method 1 – Let us look at steps to Get Raw Data from the individual analytics panels:
Step 1: First map the desired column with available e-commerce data sources, for example:

Phase 1.1 – Fetching Raw data from Facebook Ads panel.
- Step 2: Open Reports → Create a custom report.
- Step 3: Select Campaign name and Amount Spent from the data panel.

- Step 4 Select the date range.

- Step 5: Export as a .xls file.

- Step 6: Keep the downloaded raw data in a separate Google sheet tab.

Phase 1.2 – Fetching Raw data from Google Ads panel
- Step 7: Open Report → Predefined reports → Basic → Campaign.
- Step 8: You may unselect irrelevant columns while keeping Campaign and Cost columns from the interface.
- Step 9: Select the date range.

- Step 10: Download data to Google sheets and keep it in the second tab.


Phase 1.3 – Getting Raw data from Shopify panel
- Step 11: From the reports interface, select the following columns: UTM Campaign name, Orders, Total Sales, Returns.

- Step 12: Select the date range.

- Step 13: Export as .xls file and keep the data on the third tab of the Google sheet.


Phase 2 – How to Clean and Group data
- Step 14: Acquisitions mean when the column Customer type = first-time. So to get #Acquisitions column:
– for First-time customers in customer_type, Acquisition value = #Orders, and
– for Returning customers in customer_type, Acquisition value = Zero.

- Step 15: Group the data for Acquisitions, Orders, Net Sales and Returns on the basis of utm_campaign name + utm campaign source using ()PIVOT


Phase 3 – Stitch data on a common column
We need to stitch the data on the common column – Campaign. To understand data stitching further, please refer to this article.
- Step 16: Append Facebook Ads and Google Ads data.

The ‘stitch data’ tab is where you put the last piece of the puzzle. When you’re done enriching and transforming the data, you can present them in a separate tab where it’s easier to monitor.
- Step 17: Copy Shopify final data and use ()VLOOKUP to perform data stitching

Method 2 – Google sheet add-on
Create a new dimension “All campaigns” for Facebook Ads.
- Step 1: Launch EasyInsights Extension.

Phase 1 – Create cross-platform dimension
We need the common dimension “All campaigns ” to join 3 data sources.
- Step 2: Create a new dimension “All campaigns ” for Facebook Ads with the base dimension as “Campaign ” without any mapping.

- Step 3: Add Google Ads account and Shopify account to the “All campaigns ” dimension with the base dimension as “Campaign ” without any mapping.

- Now, “All campaigns ” have been successfully created as the common dimension, i.e. the cross-platform dimension across Facebook Ads, Google Ads and Shopify.

Phase 2 – Include all the base metrics
- Step 5: Go to Analytic metrics from the hamburger menu and define the first analytic metric “Acquisitions ” as “Orders ” when (in Filter) Customer type = first-time. Similarly define other metrics, Total Sales and Returns as the same without any filter.

Phase 3 – Getting the final report view
- Step 6: Move to Cross-platform section then choose “All Datasources” and select these columns: All Campaigns, Spend, Acquisitions, Total Sales and Returns.

- Step 7: Create derived columns on the sheet as: Revenue = Total Sales – Returns. ROAS = Revenue/Spend, CAC = Acquisitions/Spend.

EasyInsights does the stitching automatically once the cross-platform common dimension is defined.
As you can see above, with the EasyInsights add-on, you can complete e-commerce data stitching onto Google sheets in 7 simple steps instead of 17 in the manual method. Click here to know more about EasyInsights Data Integration.
Wanna try EasyInsights? Request a free demo.