Regardless of how much people are wary of LinkedIn for its highly professional appeal, we can’t deny that it is a powerful networking giant that can help you reach a new top-tier audience if used correctly. Understanding LinkedIn analytics is critical to your success as a marketer. That’s because being “data-driven” isn’t just a buzzword anymore; it’s a requirement. LinkedIn analytics can assist you in tracking progress, determining success, and connecting with your target audience. This guide outlines the top LinkedIn analytics you should be tracking right now and how to get started on this frequently misunderstood channel.
Jump ahead to:
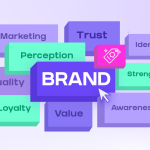
What is LinkedIn Analytics?
LinkedIn analytics is a set of metrics that show how a LinkedIn profile or page performs over time. It is the most popular social network for professionals, with over 850 million members worldwide. A LinkedIn Analytics dashboard shows data and compares the number of followers on a business page to the engagement rate. These detailed LinkedIn metrics assist you in identifying trends and determining the best way to engage with your top-tier followers.
So, how do you access your LinkedIn Analytics? When you open the LinkedIn company page you manage, you will find the LinkedIn analytics dropdown on the top menu. It’s worth noting that LinkedIn analytics are only available to those with admin access to the page. All Page administrators have access to the native LinkedIn Analytics tool. It provides detailed information about the performance of your page. Go to your company page and click on the Analytics tab to access the LinkedIn dashboard. Visitors, Updates, Followers, Competitors, Leads, and Employee Advocacy analytics are available via a drop-down menu.
Making the Most Out of LinkedIn Analytics
Marketers can access a plethora of LinkedIn metrics. But does that mean you should track, monitor, and report on all of them? Nope! That’s a lot of information.
The LinkedIn metrics you should track are determined by your marketing objectives. Keep an eye on updated analytics, for example, if your brand is attempting to engage new audiences through published posts. Track the analytics of your followers and visitors if you want to increase brand awareness on this platform.
To get the most out of LinkedIn, different goals necessitate different strategies. Acquiring high-value leads from LinkedIn Ads will require different strategies than increasing a career page’s engagement rate. Before you begin posting, please check the following boxes.
1. Create an effective LinkedIn strategy: Because LinkedIn’s algorithm prioritizes interactions, get your team involved early on to increase the reach of your content. A solid social media marketing strategy on this #1 professional network requires high-impact content from both the company page and your employees’ personal profiles.
2. Monitor key metrics: Content optimization entails monitoring key metrics and identifying patterns among winners. To automatically monitor your performance, use either the built-in LinkedIn analytics tools (e.g., real-time campaign manager) or a third-party analytics platform like EasyInsights.
3. Analyze data and make necessary adjustments: Conduct a content analysis to determine what is and is not working. For example, if you recently moved upmarket, the ads and offers that generated your first 10 SMB leads may no longer be effective.
4. Planning the road ahead: Marketers can examine engagement data from their posts. You can help your updates succeed by posting content that will be of interest to the “right” people. You must provide a compelling reason for your audience to interact with your content. This aids in making critical marketing decisions for LinkedIn.
5. Growing on Linkedin: If your audience wants to interact with your content, you can grow on the platform. LinkedIn accomplishes this in part by providing a publishing platform where you can publish full-length blog posts. Another way to boost the popularity of your LinkedIn content is to post when your target audience is most likely to be on the platform. If you want visitors to stay on your Page for more than a few seconds, make sure it is as complete as possible. Include critical organization information as well as a customized Call-to-Action button. Furthermore, provide relevant information on as many tabs as possible to increase engagement.
Unlike other marketing channels, promoting your company on LinkedIn requires a massive team effort across departments, whether it’s building an email list for a lead generation campaign or increasing video views for an evergreen webinar. The greater the involvement of your employees in spreading the word, the greater the reach and the greater the ROI of your marketing efforts.
Which LinkedIn KPIs should you Track?
LinkedIn analytics works in much the same way as any other social channel. The most important thing to understand is that the professional networking platform categorizes its data into three major categories: follower metrics, update analytics, and visitor metrics.
Follower Analytics
These metrics show who is engaging with your page’s content and updates. When you know your audience, you can create content that speaks directly to them. This can boost engagement and traffic. LinkedIn displays this information based on your followers’ location, job, seniority, industry, and company size.
Followers analytics count the number of people who want to stay in touch with your brand. Important metrics to keep an eye on for your brand include:
- Number of followers over time: This graph shows how your brand’s followers have increased (or decreased) over time.
- Total followers: The total number of current followers on your company’s Facebook page.
- Follower demographics: This is useful for understanding how your content resonates with followers in specific industries, seniority levels, and locations.
Update Analytics
Update metrics demonstrate the effectiveness of your LinkedIn updates. They can tell you whether or not your followers are responding to your updates. This data is excellent for assisting social media managers in identifying trends and patterns.
Start testing different variables, for example, if your update analytics show low post engagement. You can experiment with changing the time you schedule posts or the type of content you publish.
Here are the most important LinkedIn update metrics to monitor.
- Impressions: This metric indicates how many times your LinkedIn update was visible for at least 300 milliseconds. This tracks when the post is viewed by at least 50% of logged-in LinkedIn users.
- Engagement rate: The engagement rate is calculated by adding the number of interactions, clicks, and new followers acquired, divided by the number of impressions the post receives.
- Clicks: A click indicates that your call-to-action was successful. In other words, a user engaged with something you posted on LinkedIn rather than simply scrolling past it. When a signed-in member clicks on your post, company name, or logo on LinkedIn, clicks are recorded.
Visitor Analytics
Visitor analytics show you who is visiting your page but isn’t yet a loyal follower of your brand on LinkedIn. This data can be used to identify traffic patterns and tailor your LinkedIn updates to new visitors. This can result in visitors becoming new followers and increased social engagement.
This displays key metrics about visitors who visit your LinkedIn page but do not follow you in order to receive regular updates. Important metrics to keep an eye on for your brand include:
- Page views: The total number of times your page was visited.
- Unique visitors: The number of unique members who have visited your page. This provides you with a good idea of how many people are interested in your business.
- Custom button clicks: A custom button, such as ‘Visit website,’ ‘Contact us,’ ‘Learn more,’ ‘Register,’ or ‘Sign Up,’ can be added to your business profile. This metric displays the number of clicks your custom buttons receive in a given amount of time.
Creating a LinkedIn Analytics Report
It takes a long time to put together a set of metrics, especially when you work with dozens of channels and clients at the same time. With an automated marketing reporting tool like EasyInsights, you can reclaim hours of your time spent on reporting. All you have to do is connect your data sources once, and our tool will automatically collect data from all of your different channels and combine it into one beautiful report. This is how it works: Sign up for EasyInsights, connect your LinkedIn account, and select your metrics. The tool will generate reports and deliver them to your inbox.
Use EasyInsights to create data flow from LinkedIn to any BI tool.
The simplest way to get data from LinkedIn is by using EasyInsights. You can connect it to any BI tool and import your data. It enables faster data movement from databases such as LinkedIn or other data sources into your data warehouse for visualization in a BI tool. EasyInsights is completely automated, so no coding is required.
You can use EasyInsights to visualize data by connecting Data sources like your LinkedIn page with a single-click sign-on. Customized cross-platform metrics and dimensions can be created as well. Create your custom metrics and dimensions with EasyInsights, and join/blend all your data sources in EasyInsights itself. This will speed up the process and get insightful reports directly in BI tools of your choice that will help you make data decisions quicker and save a lot of time. EasyInsights also helps in generating useful reports. Use reports on Google Sheets to make faster data decisions, or consume it from your inbox.
Request a demo and see EasyInsights in working. Create your dataflow within minutes without any data engineering team.
Final Words
If your company only uses LinkedIn to spread the word, you’ll find all the LinkedIn reports you need on the platform. However, if you want to create a more systematic report from your analytics and make it analysis-ready, a tool like EasyInsights can help.
If your brand is active on more than one social media platform, a third-party tool like EasyInsights can be of great assistance because it gathers data from various sources and displays performance metrics across all social channels in one place. Wanna see EasyInsights in action? Book a demo now!