All marketers have some recurring questions about their audiences. Some of the questions we ask include: what was the last time users engaged with our website? Which users have high/low churn probability? Which sources and campaigns bring most users to our sites? User Lifetime Exploration in Google Analytics 4 (GA4) answers all such questions.
GA4’s user lifetime exploration report helps marketers see how users behave and interact with their websites over an extended period. You can go beyond a few sessions and understand how users behave on your website over the course of their lifetime. That’s why you must know all the nitty-gritty details of the user lifetime report.
So, let’s take a deep dive and understand what is a user lifetime exploration. We’ll also have a look at the steps to create a user lifetime report in GA4. Read on.
Jump ahead to:
Overview of GA4’s User Lifetime Exploration
The user lifetime exploration is a GA4 report that shows us how users behave on a website over the course of their lifetime. The report shows how users interact with your website after their first-ever visit.
It is important to note that GA4 shows lifetime data for users who have been active on your site after 15 August 2020. That means if a user first visited your website in, let’s say, 2019. But if they were last active on 14 August 2020, their data won’t be included.
However, if the same user was last active on a date after 15 August 2020, their data since their first visit in 2019 will be included in the report.
Before you can create a new user lifetime report, you must first know how to navigate this GA4 report builder. So, let’s have a look at a user lifetime report created in GA4.
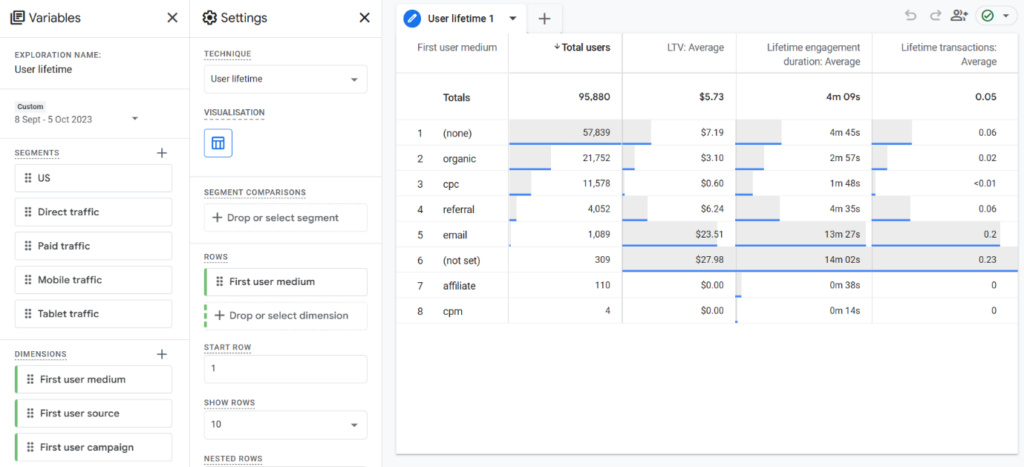
You can see that GA4 report builder has three tabs – Variables, Settings, and Report (User Lifetime 1) tab.
- The Variables tab lets you select your report’s date range, segments, dimensions, and metrics.
- The Settings tab lets you pick the reporting technique like customer lifetime, path exploration, cohort analysis, etc. It also shows options and toggles based on the report technique you select.
- The tab on the right-hand side of the screen will show your report based on your selections in the Variables and Settings tab.
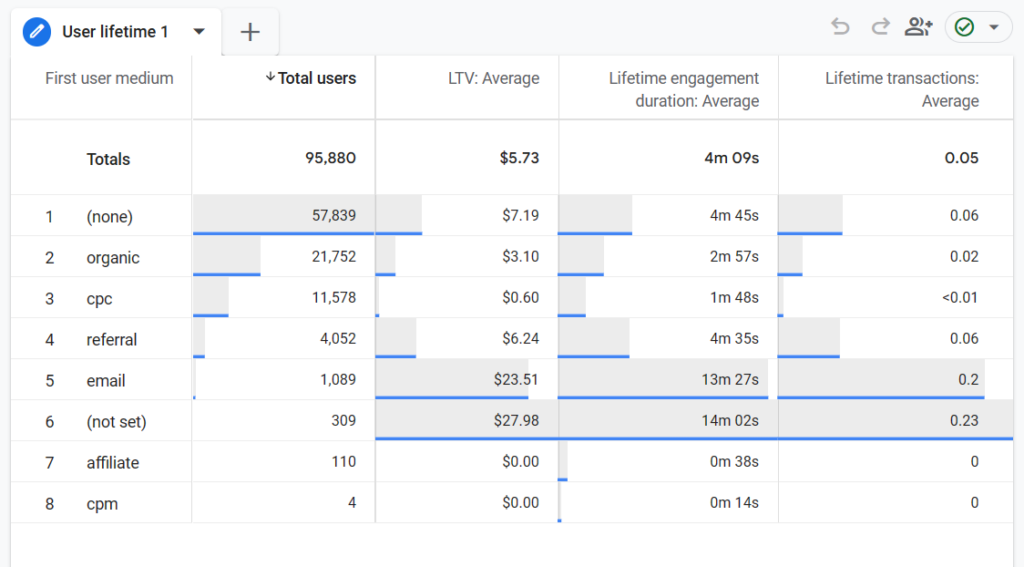
The above user lifetime report shows us the medium that visitors used to visit the website for the first time. The dimension used here is the first user medium.
As for metrics, the report tracks total users, average lifetime value, average lifetime engagement duration, and average lifetime transactions.
Additional Read: A Complete Guide to Explorations in GA4
Use Cases of User Lifetime Exploration
Here’s how to use GA4’s user lifetime exploration to your advantage.
1. Customer Lifetime Value (CLV) Analysis
CLV, as you know, is a crucial metric that helps marketers understand how much value users generate over the course of their relationship with the brand. And you can rely on GA4’s user lifetime exploration to calculate and track CLV over time.
2. Campaign Performance Analysis
User lifetime report in GA4 lets you see numbers for users based on the source, medium, and campaigns that bring them to your website. As a result, the user lifetime exploration is the perfect report to analyze the performance of different marketing campaigns. You can measure performance based on metrics like LTV, total users, average lifetime engagement duration, etc.
3. User Retention Analysis
Designing effective retention strategies and improving customer loyalty is paramount to most marketing campaigns. You can use a user retention report to understand how different user segments perform in terms of long-term engagement with your website.
Steps to Create a User Lifetime Exploration in GA4
Now, let’s create a user exploration report in GA4 from scratch.
We want to create an exploration where we will unveil data about the sources that brought users to our website and the date when they first arrived. We’ll also measure some metrics, namely total users and total LTV. So, let’s get started.
Step 1. First of all, log in to your Google Analytics account and select your desired GA4 property.
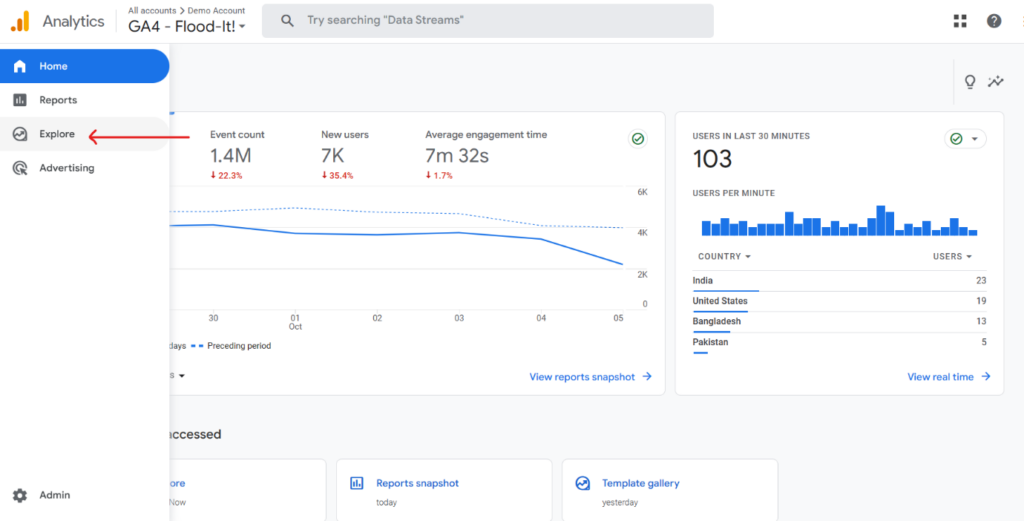
Step 2. Head over to the Explore tab in the navigation menu on your screen’s left side.
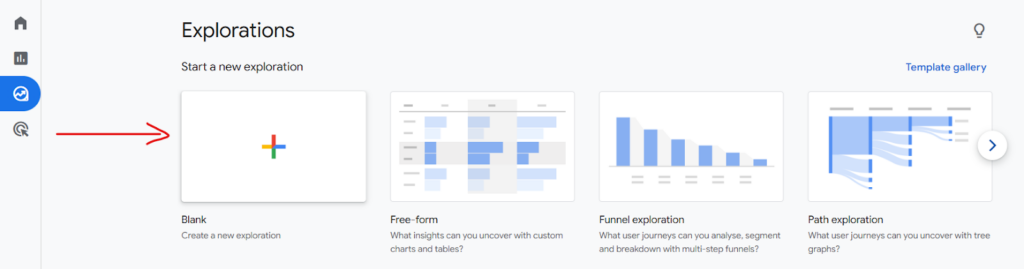
Step 3. Create a new report by clicking the Blank template in the Explorations section.
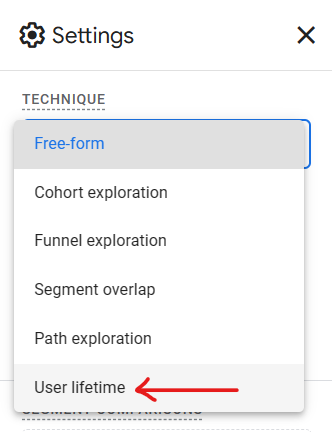
Step 4. Now, you have a blank report in front of you. To begin creating the report, head over to the Settings tab, click the drop-down menu under the Technique option, and select User Lifetime.
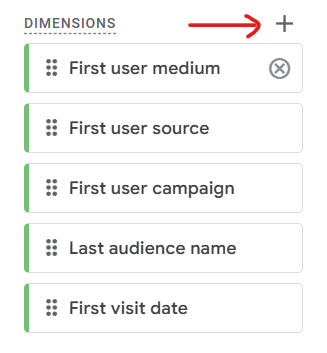
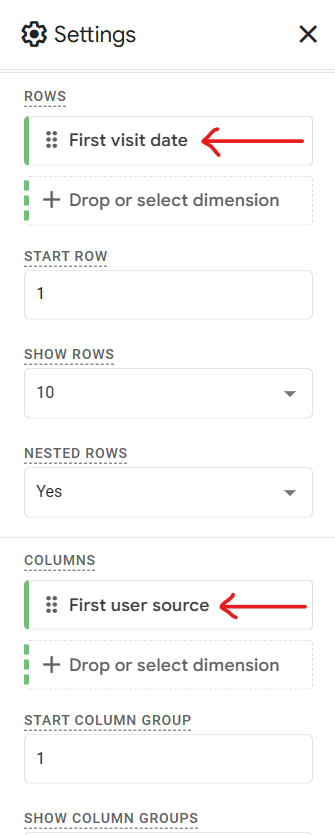
Step 5. We want user data for sources that first brought users to our website and on what date they first arrived on our website. And we’ll display this data using the First visit date and First user source dimensions.
These two items are available in the Dimensions section of the Variables tab. We can click + in that section to add more dimensions.
Now, we’ve two options: add these dimensions as rows or columns. So first, we’ll click the + icon for Rows and select the First visit date dimension. Then, we’ll add the First user source dimension in the Columns section.
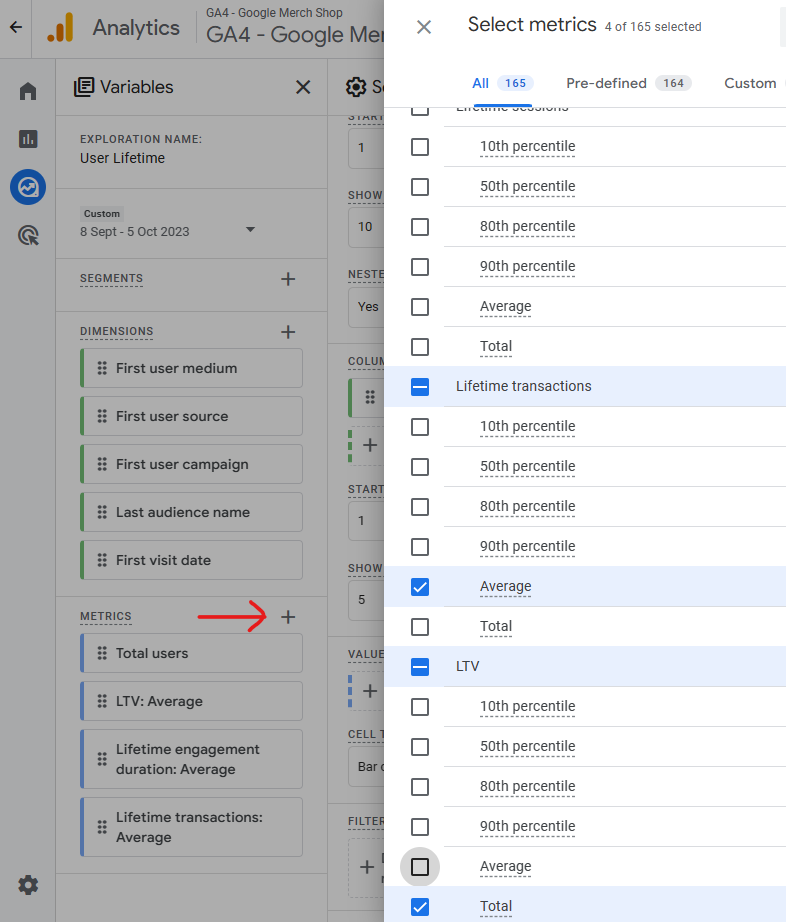
Step 6. Now, we want data for the two dimensions. For that, we’ll add metrics Total Users and LTV: Total to the Values section of the Settings tab.
But first, make sure these items are available in the Metrics section of the Variables tab. To add new metrics to this section, simply click + and pick the desired option from the Select metrics overlay. Tick the checkbox for the desired metrics and hit Import.
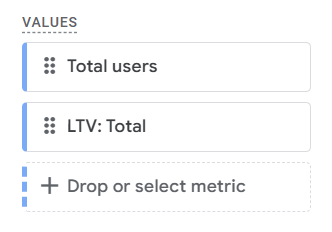
Step 7. Next, head over to the Settings tab and add these two metrics in the Values section.
Now our report is ready. Here’s what it looks like:
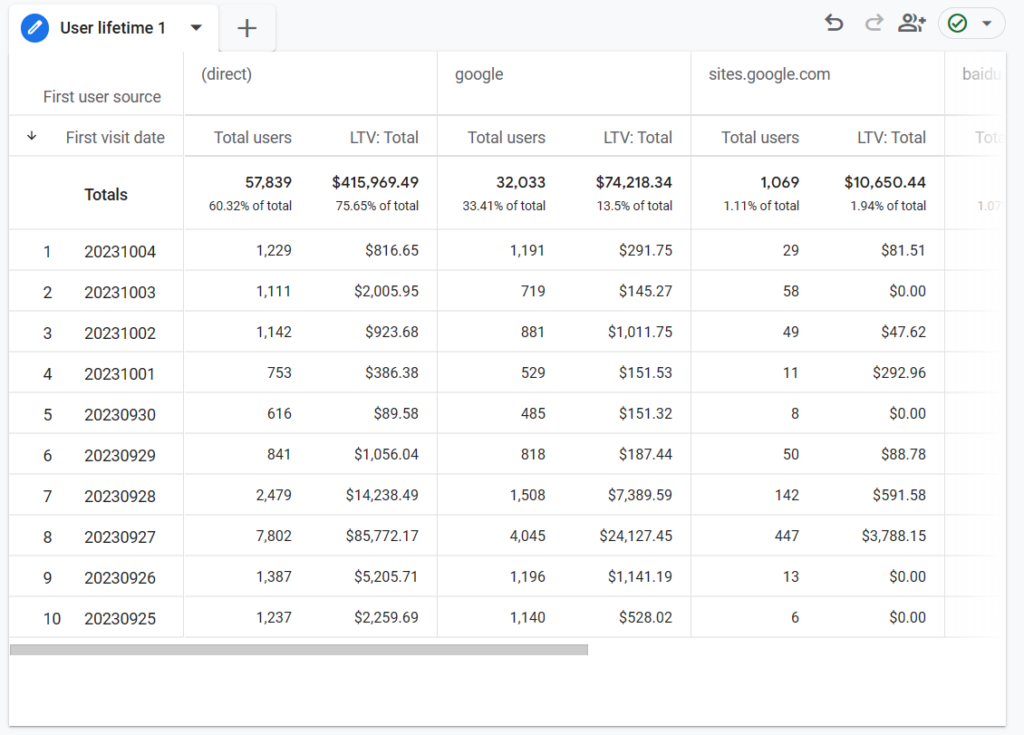
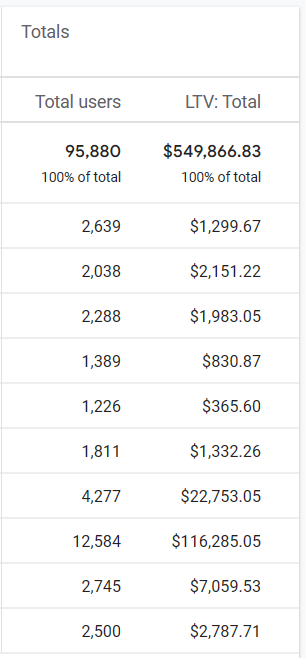
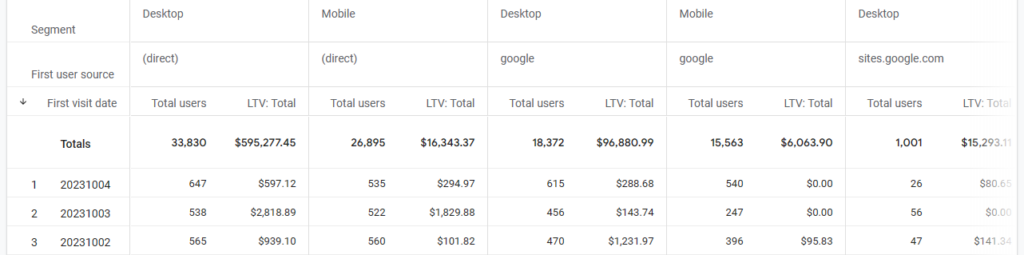
As you can see, dates appear as individual rows, while sources appear as separate columns. Each column gives us data for the total users we had on a particular date and their total LTV.
The last column of this report shows the aggregate of all the rows. We can see that 95,880 users visited our website in the selected timeframe. And they generated $549,866.83 in total lifetime value.
Additional Read: Learn to Use Standard Reports of GA4
Using Segments in GA4’s User Lifetime Exploration
We can extract more granular insights from our user lifetime report. All we have to do is add segments. Here’s how you can add segments to GA4 explorations:
Step 1. In the Variables tab, click the + icon in the Segments section.
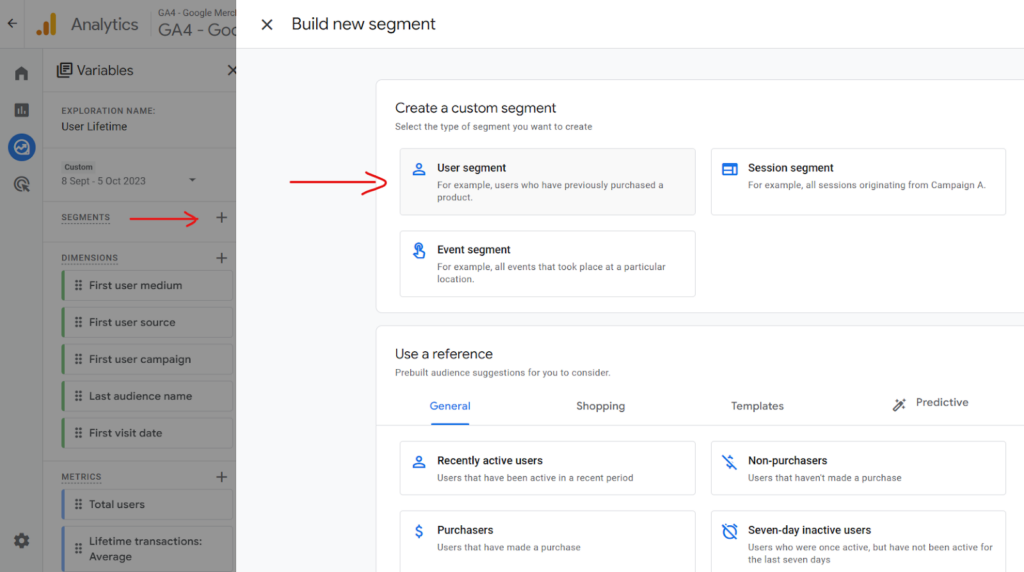
Step 2. Now, you have the “Build a new segment” overlay on your screen. Here, we can build a custom segment.
Suppose we want to add data for visitors who use desktop or mobile to visit our website. For that, click the User segment option and move on to the next step.
Step 3. Click Add new condition > Platform / device > Device Category. Then, click Add filter, set the condition as exactly matches, and enter the value as desktop. Name the segment as Desktop.
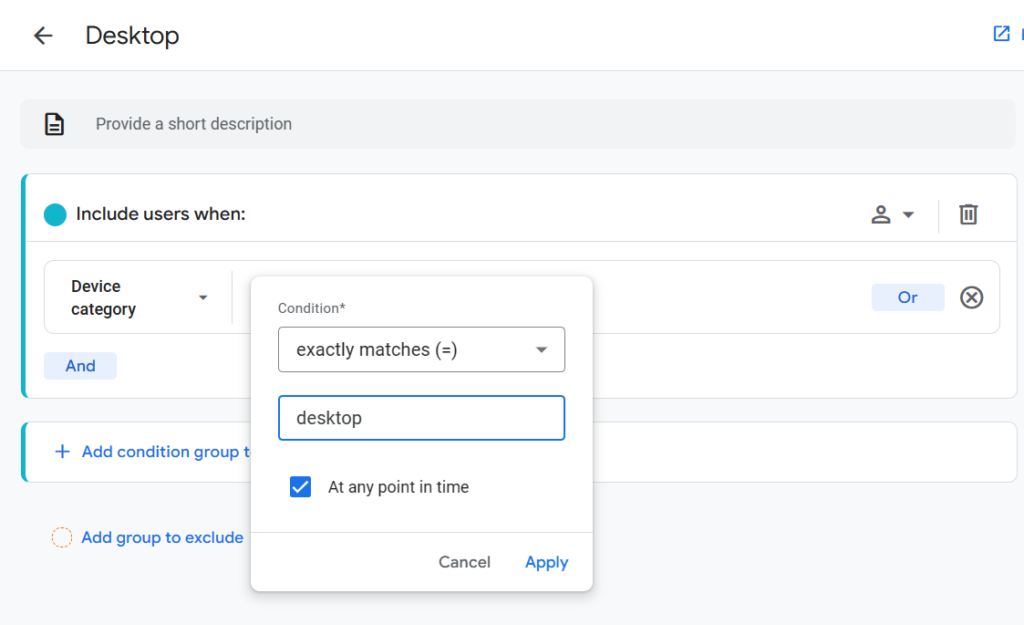
Repeat the steps to create a segment for mobile. Click Save and Apply.
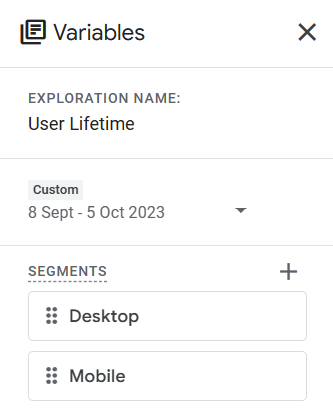
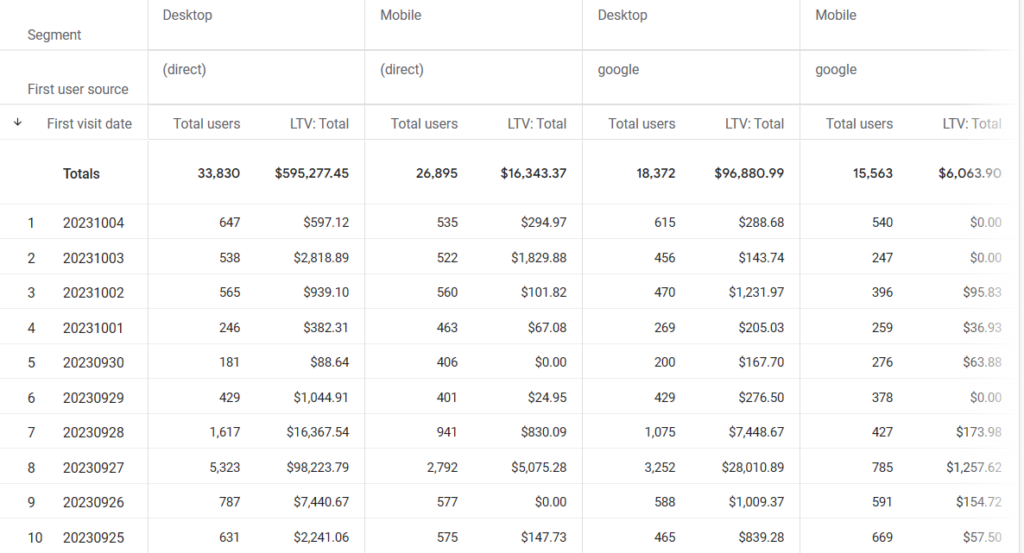
Step 4. Add Desktop and Mobile segments in the Segment Comparisons section in the Settings tab.
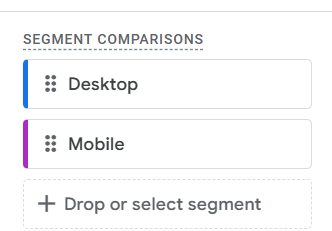
Now, we’ll be able to see what device type users used to visit our website throughout the selected period.
Some Other Settings for GA4’s User Lifetime Exploration
Let’s have a look at some other settings you can tweak to gain more actionable insights from your user lifetime exploration.
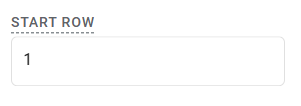
1. Start Row
As the name suggests, the Start Row setting lets you pick which row number your report starts. Simply enter a number, and GA4 will turn that row into the first row of your user lifetime report.
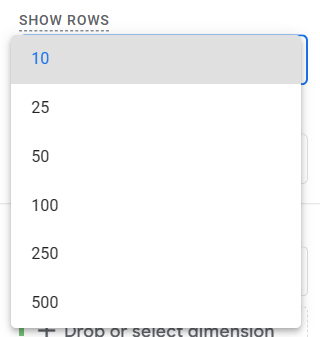
2. Show Rows
By default, you only see 10 rows of data in a GA4 user lifetime exploration. The Show Rows option lets you change the total rows visible in your report. Open the drop-down menu under Show Rows settings and pick from a desired row count. A user exploration report in GA4 can have a maximum of 500 rows.
3. Nested Rows
If you add two or more dimensions as rows, enabling Nested Rows settings makes exploring the report much easier.
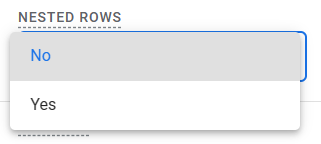
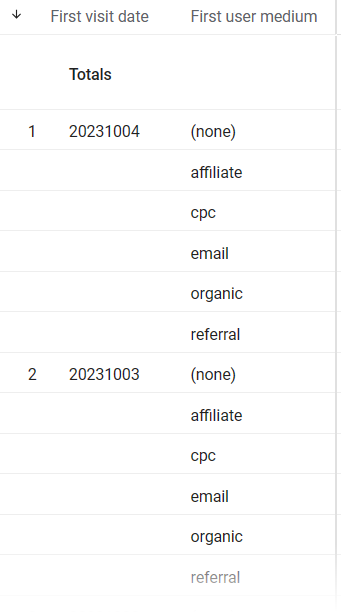
If the Nested Rows option is set to Yes, you’ll see that the rows for the first dimension are grouped, and rows for the second dimension appear in that group.
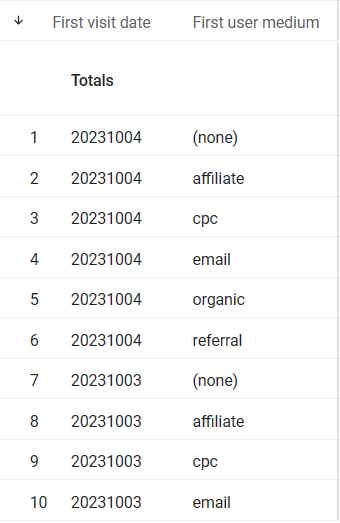
If the setting is set to off, you’ll see that rows for any dimension are not grouped together, but they appear individually.
4. Start Column Group
Like the Start Row setting, the Start Column Group option lets you set which column group will appear at the beginning of your report. You can enter a desired column group number in the settings section, and your report will be modified accordingly.
5. Show Column Groups
You can also tweak the total number of columns in your user exploration report. Head over to the Show Column Groups section in the Settings tab and pick a desired option. Your report can either have 5, 10, 15, or 20 columns.
6. Cell Type
The Cell Type setting lets you customize the table visualization of your report. You get three options: Plain Text, Bar Chart, and Heat Map.
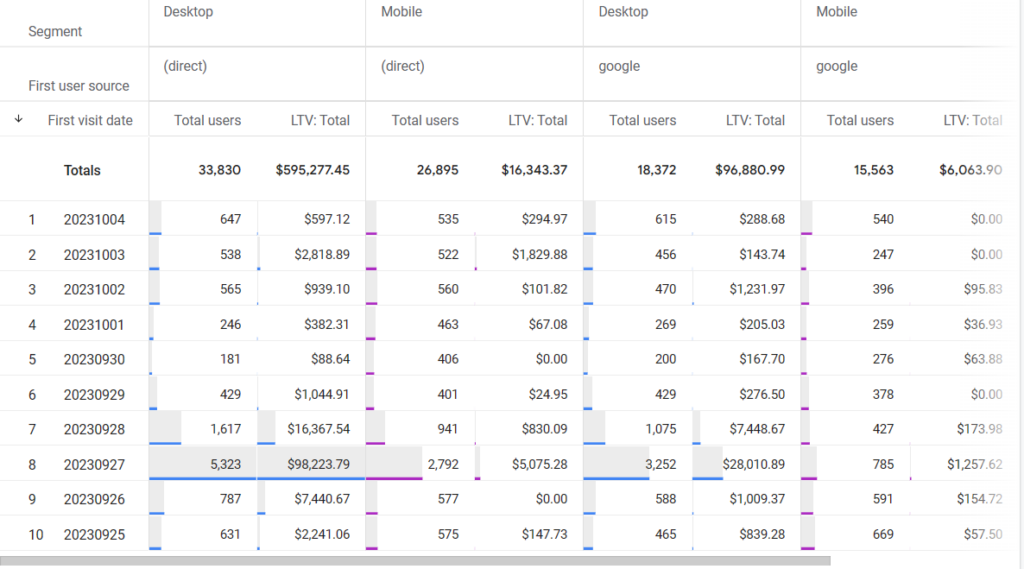
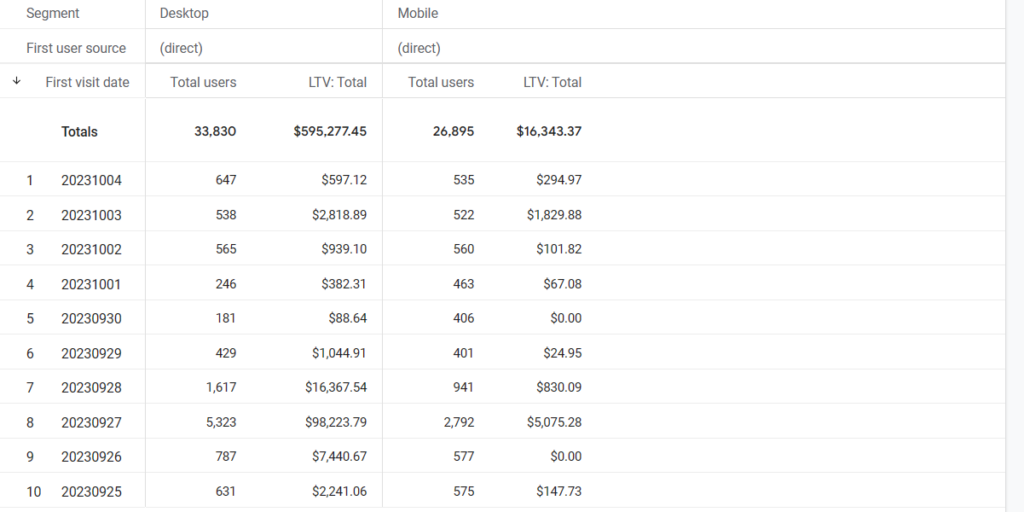
- The plain text option shows only numbers in cells for selected dimensions and metrics. Here is a user explorer report with plain text cells.
- The bar chart option adds a bar in each cell along with numbers. See the report with the bar chart below.
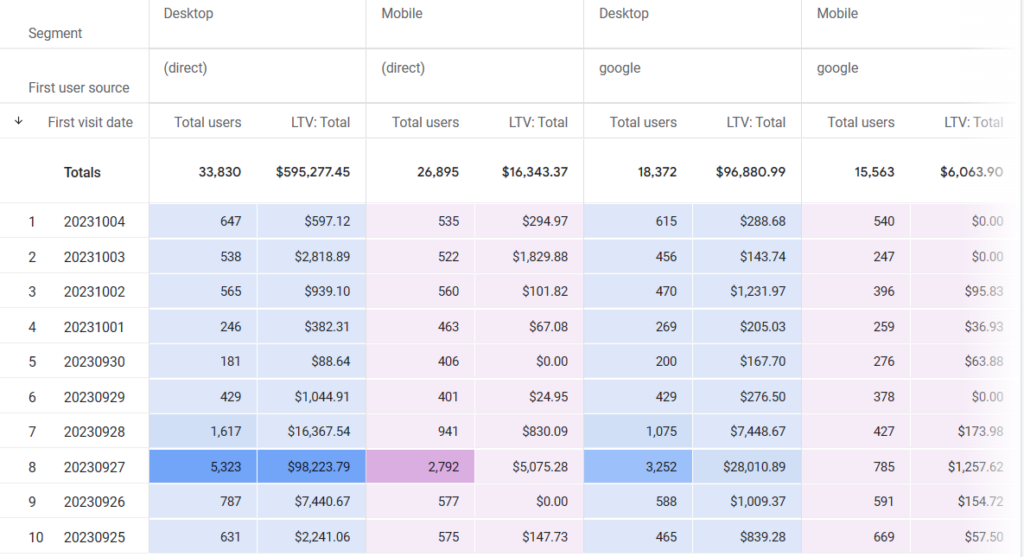
- The heat map option adds a background to cells with different colors and intensities. Below is a user lifetime report with a heat map.
7. Filters
The filter option lets you remove unnecessary information from your report and display only the needed data. You can select a dimension or a metric to create a filter. You must also specify a condition and pick a desired expression from the list.
Suppose we only want data for users coming from direct sources. So, we’ll select the First user source dimension. The condition is set to exactly match, and the expression is (direct).
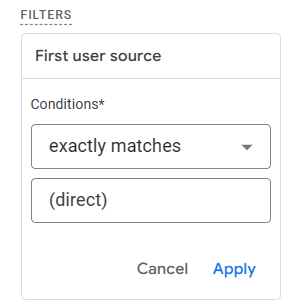
Now, our report only shows data for users coming from direct sources.
Additional Read: Data Democratization: Everything You Need to Know
Final Words
User lifetime exploration report helps you measure metrics like LTV, engagement duration, transactions, etc., since the date visitors first arrive on your website. So, this report must be a main-stay in your marketing analytics.
However, there’s so much more you can do when you combine GA4 raw data with your adtech data via EasyInsights
How EasyInsights works with Raw GA4 Data for Data Activation and Enrichment
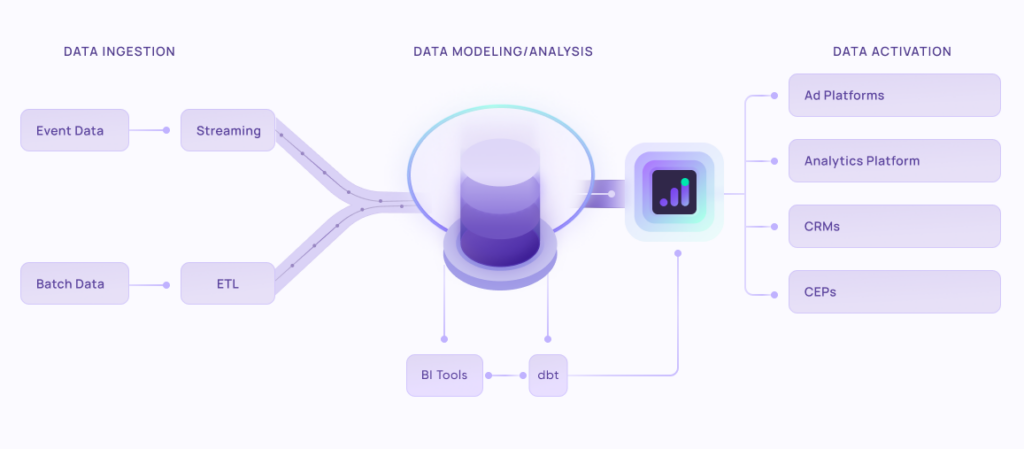
EasyInsights works with raw GA4 data for data activation and data enrichment in a few key ways:
Data Collection and Transformation:
- EasyInsights connect directly to your Google Analytics 4 property allowing it to access and extract the raw GA4 data you’ve collected.
- Data Transformation: EasyInsights then cleans, normalizes, and enriches the data to make it usable for activation purposes. This may involve tasks like:
- Formatting data: Ensuring all data points are in a consistent format.
- Handling missing values: Filling in missing data points or removing them according to your preferences.
- Enriching data: Adding additional data points from other sources to create a more comprehensive picture of your customers.
Data Activation:
- Segmentation and Targeting: It allows you to segment your audience based on various criteria like demographics, behavior, and interests using the enriched GA4 data.
- Multi-channel Marketing: You can then use these segments to activate your audience across different marketing channels like email, social media, and advertising platforms.
- Customer Relationship Management (CRM): The data can be used to personalize outreach and interactions with customers within your CRM system.
- Marketing Attribution: EasyInsights can help you understand how different marketing channels contribute to conversions and optimize your marketing spend accordingly.
Key Feature:
- Offers features like customer data platform (CDP) capabilities, marketing automation, and campaign management tools.
- Focuses on reverse ETL (extracting data from your warehouse and sending it to marketing tools) and offers pre-built integrations with various marketing platforms.
EasyInsights is a marketer’s preferred tool for first party data activation.
In this age of cross-channel marketing, EasyInsights offers a comprehensive platform to collect, store, and transform all your first-party data.
EasyInsights enhances marketing campaign efficiency in a cookieless landscape with accurate ad signals. It helps brands step away from surface-level metrics and unleash the potential of first-party data to optimize marketing strategies, ensuring a superior Return on Ad Spend (ROAS). It does all this, while being a highly affordable no-code platform with an exceptional customer support apparatus.
Sign up for a demo today to see EasyInsights in action.