When performance data creates confusion instead of clarity, decision-making slows down. Different platforms report conflicting results, and leaders struggle to understand what’s truly driving growth. Even with more data available than ever, teams hesitate to act because the insights don’t align. The outcome is delayed decisions, gut-driven calls, and wasted budgets, not due to lack of data, but lack of trust in it.
In this blog, we’ll discuss the root causes behind mistrusted reports and outline practical ways to create transparency across marketing platforms.
Jump ahead to:
The Trust Gap: Why Leaders Question Marketing Reports

When leaders question marketing reports, it’s rarely because performance is poor. It’s because the data itself feels unreliable. The trust gap isn’t caused by surface-level reporting issues-it’s rooted in how data is collected, processed, and presented across platforms.
Conflicting Numbers Across Platforms
One of the most common sources of distrust is inconsistency. The same conversion appears differently in Google Ads, Meta, GA4, and the CRM. Each platform uses its own tracking logic, attribution windows, and deduplication rules. Without a unified data foundation, teams are left comparing numbers that were never designed to match. When no single version of truth exists, confidence in all reports erodes.
Black-Box Attribution Models
Most ad platforms rely on proprietary attribution models that offer little transparency. Conversions reported inside platforms often don’t reflect real business outcomes, yet leaders are expected to make budget decisions based on them. To make matters worse, these models evolve silently-methodologies change, but reports don’t clearly explain why results suddenly shift. What looks like a performance fluctuation is often just a modeling update.
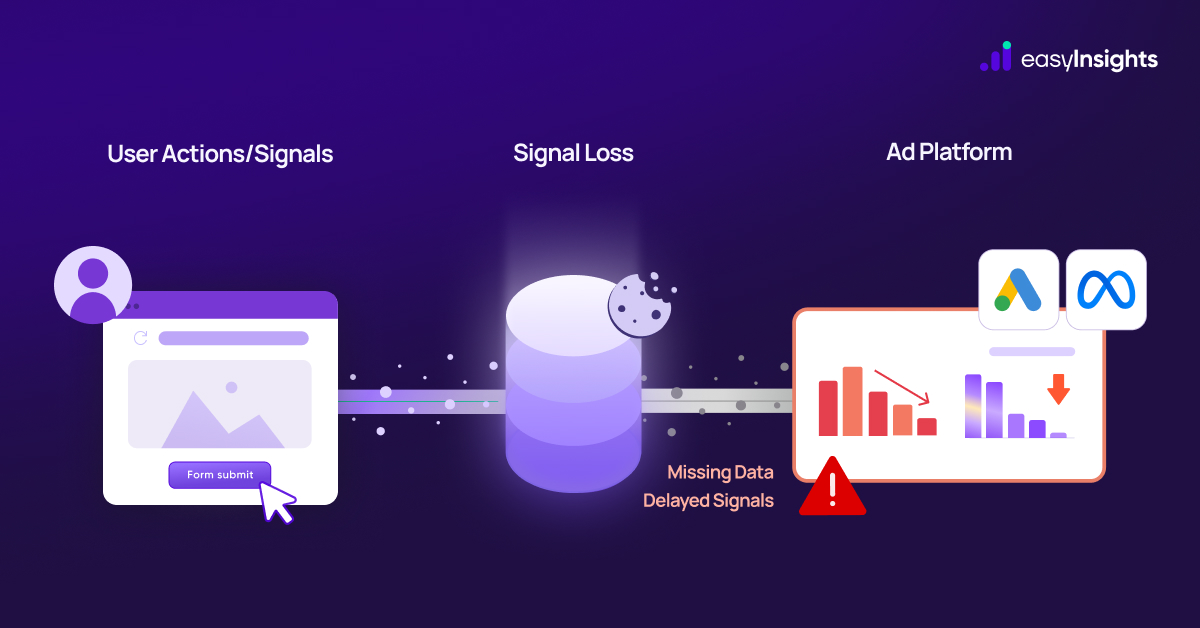
Fragile Tracking Foundations
Modern tracking is increasingly unreliable. Cookies expire, browsers restrict scripts, and ad blockers block events, causing conversions to be missed or delayed. Decisions are often made before gaps are discovered, creating hidden instability that leaders can sense but not always explain.
Metric Overload, Insight Deficit
Teams often mistake more metrics for better insight. Vanity numbers fill reports, while the outcomes leaders care about – revenue, efficiency, and growth – remain unclear. When data lacks clarity, trust breaks.
What “Transparency” in Reporting Really Means
Transparency isn’t about more data – it’s about data that’s clear, explainable, and trustworthy.
Defines transparency as making material facts available in a timely and reusable way so stakeholders can construct their own analyses, implying clarity and trustworthiness rather than just more data.
Transparency isn’t about perfection-it’s about honesty.
How to Build Transparency Across Platforms (and Win Back Trust)
The good news? This problem can be fixed. But it doesn’t happen automatically. It requires the right systems, clear processes, and better collaboration between teams.
According to Adverity’s 2025 data quality research, 43% of CMOs say less than half of their marketing data can be trusted, showing widespread distrust in the numbers teams use to make decisions.
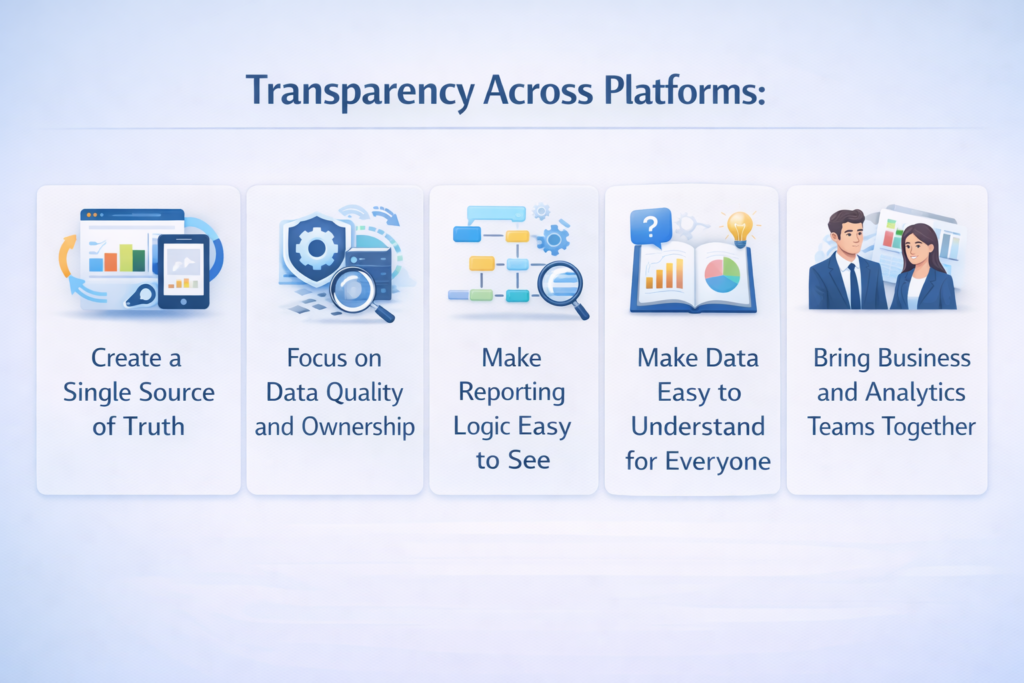
1. Create a Single Source of Truth
Decision-makers need one place they can trust for numbers.
That means:
- Bringing data from all platforms into one system
- Using the same definitions for key metrics like leads, revenue, and conversions
- Making it clear how each number is calculated
When everyone looks at the same data and speaks the same language, confusion disappears – and confidence goes up.
2. Focus on Data Quality and Ownership
If the data going in is wrong, the report will be wrong.
To avoid this:
- Automatically check data for errors
- Clean and fix broken or missing data
- Assign clear owners who are responsible for data accuracy
When leaders know the data is well-maintained, they are far more likely to trust the reports.
3. Make Reporting Logic Easy to See
Trust increases when people understand where numbers come from.
Do this by:
- Showing how raw data turns into final metrics
- Clearly explaining calculations and filters
- Allowing users to trace a report back to its source
This removes the “black box” feeling and helps leaders trust the logic behind the numbers.
4. Make Data Easy to Understand for Everyone
Not every decision-maker is a data expert – and that’s okay.
Help them by:
- Training teams on how to read and use reports
- Using simple dashboards instead of complex tables
- Explaining what a metric means and why it matters
When leaders understand the story behind the numbers, they’re more confident acting on them.
5. Bring Business and Analytics Teams Together
Analytics should support decisions – not sit in isolation.
To build trust:
- Involve leaders when deciding what should be measured
- Review assumptions with business teams
- Build dashboards based on real business goals
When reports are created with decision-makers, not for them, trust naturally follows.
Where MMM, Attribution & Incrementality Fit
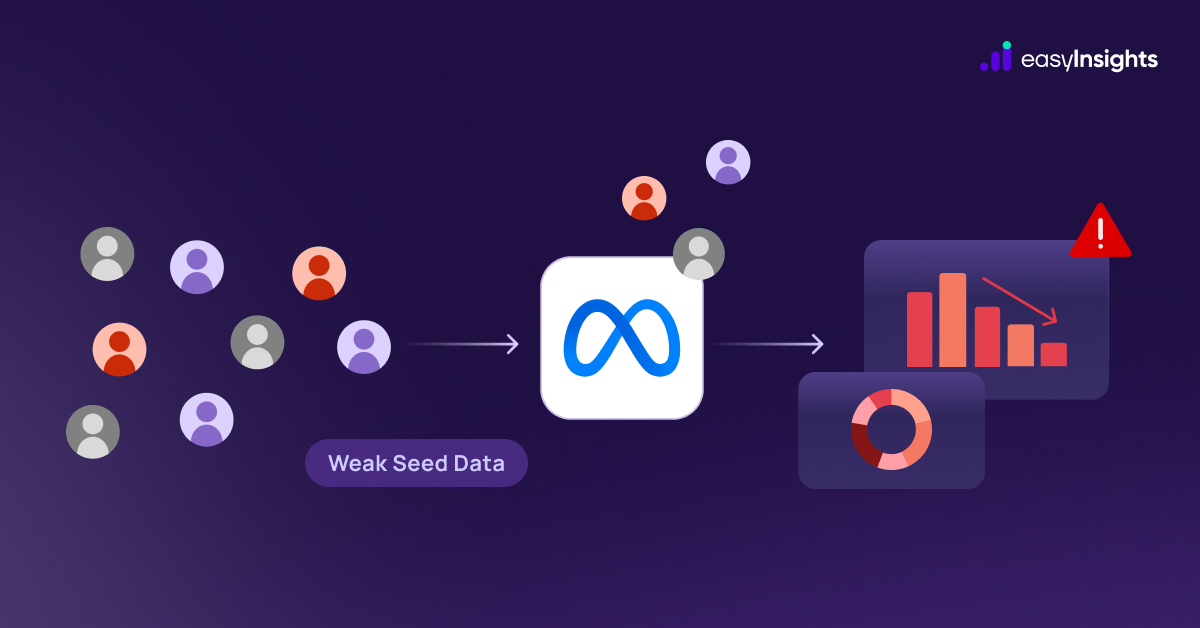
Marketing models are powerful-but only when used for the right purpose. Problems arise when teams treat models as decision-makers, rather than decision-support tools.
Attribution models, MMM, and incrementality testing all rely on inputs. When those inputs are fragmented, delayed, or inconsistent, the outputs appear sophisticated but mask underlying data issues. No model can fix broken or incomplete conversion data.
That’s why models should inform decisions, not replace judgment or foundational data trust. Where each model fits best:
- MMM (Marketing Mix Modeling): Best for long-term strategic planning, understanding channel trends, budget allocation, and macro-level impact. Not meant for daily optimization.
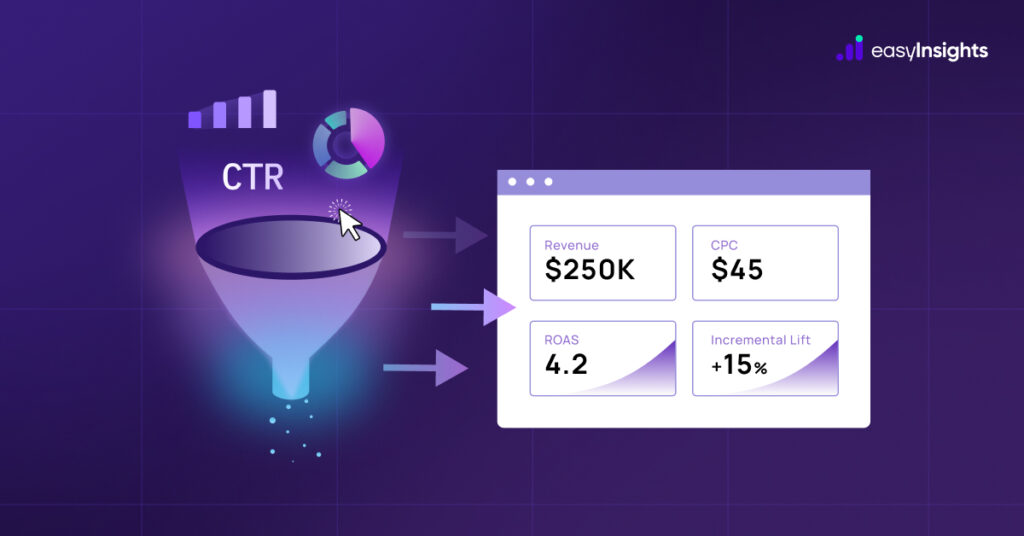
- Incrementality Testing: Used for hypothesis validation, testing whether a channel or tactic drives true incremental lift. Results are directional and context-specific.
- Day-to-Day Decisions: Should rely on clean, trusted conversion data, consistent tracking, deduplication, and a clear link between spend and outcomes for daily optimization.
When models are layered on top of a strong data foundation, they add clarity. Without that foundation, they add confidence to the theatre. Transparency starts with trusted data models, which come second.
Also Read: Marketing Mix Modelling: A Comprehensive Guide
Where EasyInsights Fits In
EasyInsights acts as the data foundation layer between your website, CRM, and advertising platforms—ensuring every system works from the same, trusted source of truth.
1. Clean First-Party Data Collection
- Collects high-quality first-party data using server-side tracking
- Reduces signal loss caused by browsers, devices, and platform restrictions
2. Standardized Event Definitions
- Standardizes events at the source
- Ensures every tool uses the same conversion logic and definitions
3. Accurate Conversion Deduplication
- Deduplicates conversions before data reaches ad platforms or analytics tools
- Prevents inflated or mismatched conversion counts
4. One Consistent Data Foundation
- Eliminates the need to reconcile conflicting numbers across tools
- Creates a single, explainable source of truth for marketing, growth, and leadership teams
Final Thoughts
Decision-makers don’t lose trust because reports look bad – they lose trust because the data underneath feels unstable. Transparency isn’t about better charts or more metrics.
It comes from owning your data, defining it clearly, and sending the same truth everywhere.
Fix the measurement layer, and clarity follows. Fix clarity, and confident decisions follow.
See how EasyInsights helps teams rebuild trust in their data – book a demo today.