Organizations rely on a variety of Business Analytics and Data Visualization Tools to gain meaningful insights into data. Google Data Studio is a business analytics tool that allows businesses to create reports on organizational data and make data-driven decisions. Google Data Studio is widely used because it can access data from various Google Suite applications.
However, Google Data Studio can integrate with External Data Sources or Database Management Applications such as PostgreSQL, SQL, and MySQL in addition to Google Suite products. You can easily fetch or access data from specific databases to perform tasks such as Google Data Studio PostgreSQL integration and data analysis with improved visualizations. In this article, you will learn how to use the Google Data Studio PostgreSQL connector to connect Google Data Studio to a PostgreSQL database.
Also read: How to connect Tableau with Postgres, and Microsoft Power BI with Postgres.
Jump ahead to:
What is PostgreSQL?
PostgreSQL is widely regarded as one of the most advanced open-source databases available. It is powerful and well-suited for business intelligence applications. It is both scalable and elegantly designed. PostgreSQL is a robust, open-source object-relational database system that employs and extends the SQL language and includes numerous features for safely storing and scaling the most complex data workloads.
PostgreSQL includes several features intended to help developers build applications, administrators protect data integrity and build fault-tolerant environments. You manage your data no matter how large or small the dataset. This is why it is so well-liked in the market.
According to the StackOverflow “2021 Developers Survey“, PostgreSQL is the second most-used database technology, trailing only MySQL, and its popularity is growing steadily. Because even though only about 26% of developers were using it in 2017, that number rose to 34% in 2019 and even more than 40% in 2021.
What is Google Data Studio?
Google Data Studio is an open-source tool for converting data into interactive, user-friendly reports and dashboards. It enables organizations to create and share data visualizations with teams, allowing them to make more informed decisions. You can interpret your data using charts, graphs, pie charts, geography maps, pivot tables, browseable tables, and other tools in Google Data Studio.
You can use Google Data Studio to create dashboards that answer specific questions about your business. Organizations can use Google Data Studio to pull information from various data sources to understand their customers across their business operations better.
Ways to connect Google Data Studio and Postgres
Method 1: Using PostgreSQL Connector to Connect Google Data Studio to PostgreSQL
Follow the steps below to connect your Google Data Studio to the PostgreSQL database.
- Step 1: Create an account with Google Data Studio if you don’t already have one. Log in to your account if you have one.
- Step 2: Click the “+Create” button in the top left corner to add a new Data Source.
- Step 3: As shown in the image below, select the Data Source option.
- Step 4: Look for and install the Google Data Studio PostgreSQL connector. It’s visible in the window below.
- Step 5: Configure the Data Server credentials. After selecting the PostgreSQL connector, the Database Authentication window will appear. It has the following features.
- Host Name/IP Address: The Data Server’s IP address.
- Port: The PostgreSQL connector’s port on the Data Server. By default, it is 5432.
- Database: The database’s name. It is a PostgreSQL database in this case.
- Username: The PostgreSQL database’s username.
- Password: The PostgreSQL database’s password.
- SSL Connection: The SSL connection is shown here. By checking it, you can enable a secure SSL connection.
Fill in the details.
- Step 6: Choose a data table.
In Data Server, you can select any data table.
Google Data Drive introduced a new feature in 2018 that allows you to use a query to transform your PostgreSQL data into a preferred format before connecting it to your Google Data Drive. You can use this feature to import aggregated data from your data table rather than the entire data table.
- Step 7: Create a data table.
You must give the new data table a name. You can also change the names of the columns, as well as the data type and aggregate function.
- Step 8: Produce reports.
After connecting the Google Data Studio PostgreSQL database, you can generate reports for the zoo dataset by creating charts.
You can also display the number of animals in your zoo-data-counted dataset. Any changes made to the PostgreSQL table will be reflected in Google Data Studio. You can see them by refreshing the above-mentioned charts.
Method 2: Using CData Connect Cloud to Create Google Data Studio PostgreSQL Data Reports
You can create reports with visualizations for your clients using the Google Data Studio PostgreSQL connection. You can also connect to CData Connect Cloud to get immediate access to PostgreSQL data for visualizations.
Using CData to Connect to a PostgreSQL Database
Follow these steps to create a virtual PostgreSQL database and generate reports from it using Google Data Studio.
- Step 1: If you don’t already have an account, sign up for a free trial at CData Connect. Proceed to the next step if you have one.
- Step 2: Sign in to CData Connect Cloud and navigate to Databases. In a new window, it will display the available data sources.
- Step 3: Choose the PostgreSQL database.
- Step 4: Fill in the authentication details for connecting to the PostgreSQL database, such as the connection name, username, password, and security token.
To connect to the PostgreSQL database, use port 5432 as the default. Set your server’s username and password. The database property is then linked to the default database.
- Step 5: Navigate to the Test Database tab.
- Step 6: Now, go to the Privileges tab and either add a new user or use an existing user with appropriate permissions.
Using Google Data Studio to Visualize PostgreSQL Data
Here’s how to use Google Data Studio to visualize PostgreSQL data.
- Step 1: Open Google Data Studio and navigate to Data Sources.
- Step 2: Create a New Data Source and select CData Connect Cloud Connector from the drop-down menu.
- Step 3: To connect with the external service, you must authorize the CData Connect Cloud connector.
- To connect to your Connect Cloud instance, enter your instance name as myinstance in myinstance.cdatacloud.net. You must also enter your username and password to connect to your Connect Cloud instance.
- Step 4: Select the PostgreSQL database and press the Next button.
- Step 5: Select the table and press the Next button.
- Step 6: In the top right corner, click the Connect button.
- Step 7: Now, you can change the columns. After that, click Create Report.
- Step 8: Incorporate the data source into your report.
Select the visualization type and insert it into the report. You can customize the visualization by selecting the dimensions and measures.
You may need to import data from various ad platforms to create a comprehensive marketing report. Investing countless hours each day to collect and maintain data in a Postgres database is a tedious and time-consuming task that results in unnoticeable errors. Logging in to multiple platforms and exporting, transforming, and uploading data to BI tools consumes more than 40% of marketers’ time.
This is where a tool like EasyInsights can help! EasyInsights’ allows you to fully automate and secure data transfers from any source without having to rewrite the code. It allows you to not only export and load data but also transform and enrich it so that it is ready for analysis. Although you can manually connect the tools, EasyInsights makes it easier to use Google Data studio by allowing you to pull data from other data sources and integration tools.
You can connect all your data sources to EasyInsights with a few clicks, and access your transformed business ready data in Google Data Studio in a flash.
To access your data in Google Data Studio, follow the steps below.
Step1: Go to the Data Studio Overview Page.
Step 2: Select CONNECT TO DATA.
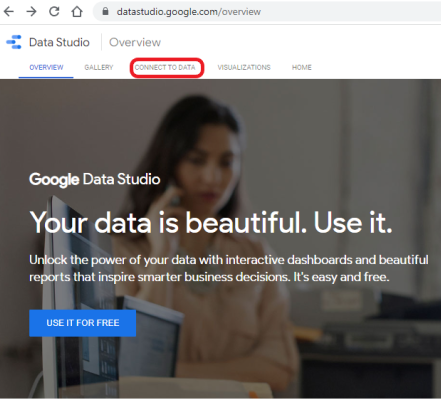
If you’re already logged in, click the + button in the upper left corner and then select Data Source.
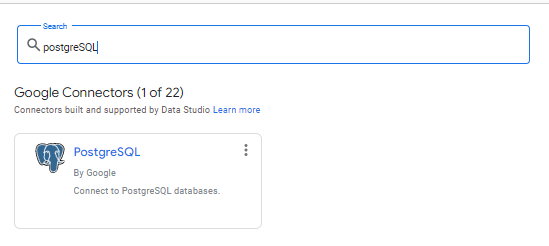
Step 3: Choose the PostgreSQL connector from the list. Sign in using your Google account (if required).
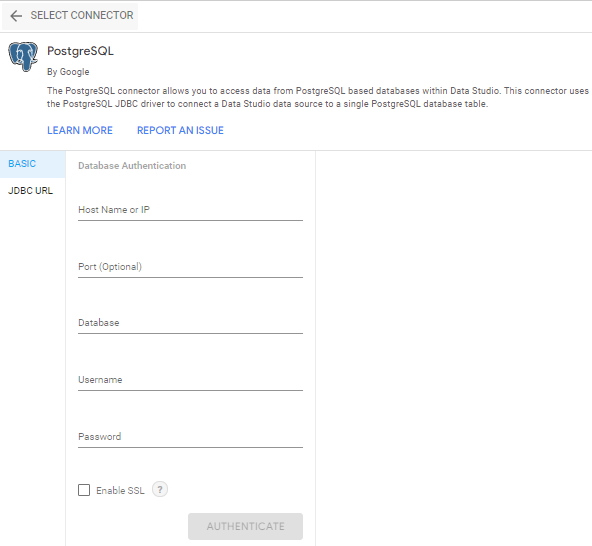
Step 4: Under BASIC, enter the following information on the left side of the page: host (or) IP address, port, database, username, and password. This information can be found on the data destination page in EasyInsights.
Select the Authenticate option.
It shows a list of tables from which you can select the one you require.
You can change the data source’s name from “Untitled Data Source” to something else. It is possible to change it later by selecting it from the list of data sources.
Step 5: Click Connect in the upper right corner.
The data source fields panel appears. Your data set has been linked to the data source.
Benefits Of Using EasyInsights
- Completely automated: The EasyInsights platform is simple to set up and requires little maintenance.
- Real-time Data Transfer: EasyInsights offers real-time data migration so that you always have analysis-ready data.
- 100% Complete & Accurate Data Transfer: EasyInsight’s robust infrastructure ensures dependable data transfer with no data loss.
- Scalability: EasyInsights has built-in integrations from all the popular marketing data sources, allowing you to scale your data infrastructure as needed.
- Generate Insightful reports: EasyInsights helps in generating useful reports. Use reports on Google Sheets to make faster data decisions, or consume it from your inbox.
Wrapping Up
This guide taught you how to connect PostgreSQL to Google Data Studio. It can be difficult to integrate disparate data when dealing with multiple data sources, such as PostgreSQL databases and SaaS applications like Google and Facebook Ads.
Integrating and analyzing data from a wide range of sources can be challenging; this is where EasyInsights comes in. EasyInsights supports pre-built data integrations from all the popular marketing data sources. It provides a fully managed solution for your Google Data Studio data migration process. It will automate your data flow in minutes without requiring you to write a single line of code. EasyInsights provides a truly efficient and fully automated solution for managing data in real time and always having analysis-ready data at Google Data Studio. Book a demo and talk to our product expert to know more about EasyInsights.
Bonus Read: Unlock First-Party Data for Audience Activation and Data Enrichment
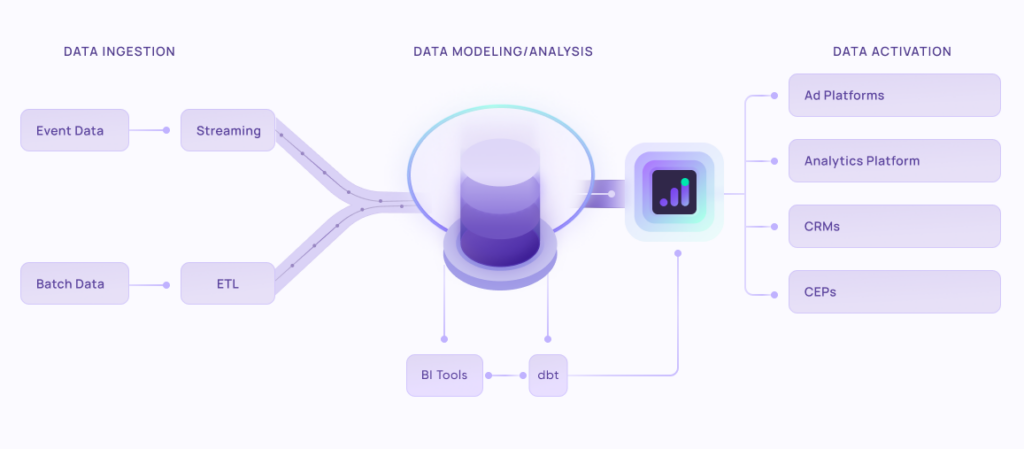
EasyInsights works with data from various platforms for data activation and data enrichment in a few key ways:
Data Collection and Transformation:
- EasyInsights connect directly to your CRMs, ad platforms, analytic platforms, CEPs and other tools allowing it to access and extract the raw data you’ve collected.
- Data Transformation: EasyInsights then cleans, normalizes, and enriches the data to make it usable for activation purposes. This may involve tasks like:
- Formatting data: Ensuring all data points are in a consistent format.
- Handling missing values: Filling in missing data points or removing them according to your preferences.
- Enriching data: Adding additional data points from other sources to create a more comprehensive picture of your customers.
Additional Reading : Composable CPDs : Some Common Misconceptions
Data Activation:
- Segmentation and Targeting: It allows you to segment your audience based on various criteria like demographics, behavior, and interests using the enriched first-party data.
- Multi-channel Marketing: You can then use these segments to activate your audience across different marketing channels like email, social media, and advertising platforms.
- Customer Relationship Management (CRM): The data can be used to personalize outreach and interactions with customers within your CRM system.
- Marketing Attribution: EasyInsights can help you understand how different marketing channels contribute to conversions and optimize your marketing spend accordingly.
Key Feature:
- Offers features like customer data platform (CDP) capabilities, marketing automation, and campaign management tools.
- Focuses on reverse ETL (extracting data from your warehouse and sending it to marketing tools) and offers pre-built integrations with various marketing platforms.
EasyInsights is a marketer’s preferred tool for first party data activation.
In this age of cross-channel marketing, EasyInsights offers a comprehensive platform to collect, store, and transform all your first-party data.
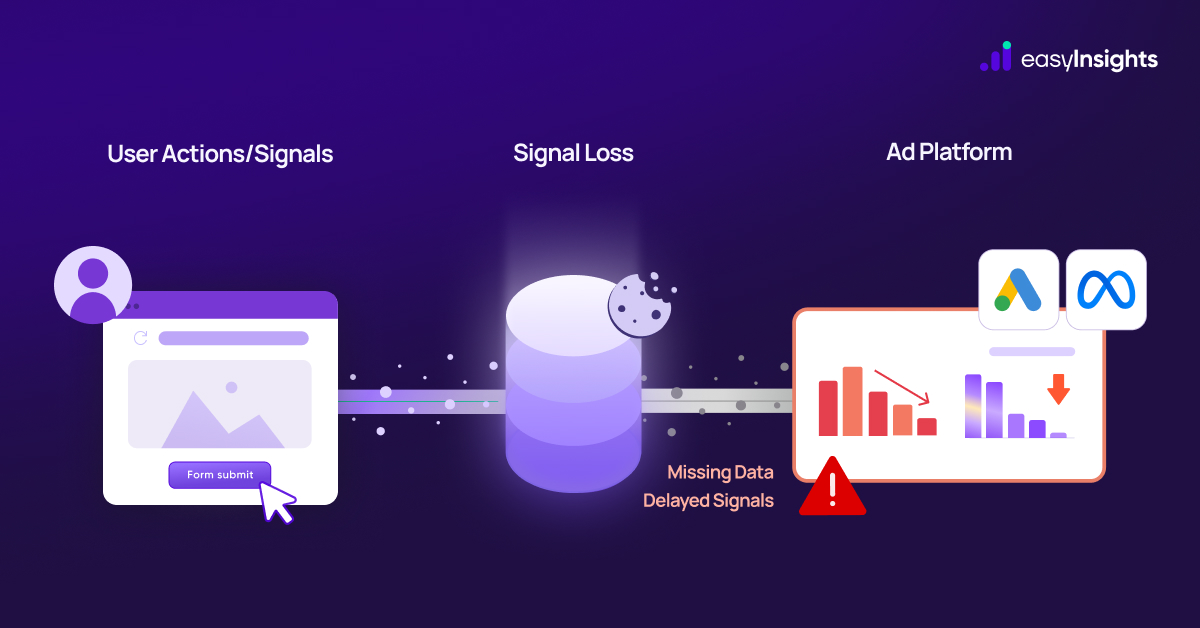
EasyInsights enhances marketing campaign efficiency in a cookieless landscape with accurate ad signals. It helps brands step away from surface-level metrics and unleash the potential of first-party data to optimize marketing strategies, ensuring a superior Return on Ad Spend (ROAS). It does all this, while being a highly affordable no-code platform with an exceptional customer support apparatus.
Sign up for a demo today to see EasyInsights in action.