You might use Google Looker Studio to create reports and dashboards for your clients or yourself. Looker Studio is a fantastic tool for data visualization that greatly simplifies the process of exploring and visualizing data while requiring almost no programming skills. However, because of its simplicity of use and enormous data load in the backend, Data Studio dashboards might slow down more than they should. Occasionally, it can be a little slow, especially if you have a lot of data in your account or if you have a poor data structure. We will demonstrate 2 ways to make Data Studio run faster and smoother.
Additional Read: A quick comparison between Google Data Studio and Tableau – Digital Marketer Version.
Jump ahead to:
What is Google Data Studio?
A platform for data visualization called Looker Studio formerly known as Google Data Studio makes generating and comprehending reports simpler. It enables you to combine data sets from many locations into one place to create a report that is simple to interpret. Additionally, Looker Studio is freely accessible. For marketers, analytics can be challenging, and data can be confusing, intimidating, and difficult to understand.
Data is challenging to comprehend due to information overload. But if you use Google Looker Studio, it provides you with everything you need to leverage data visualization to turn analytics data from your client into informative, simple-to-understand reports. You can generate reports that both you and your clients can easily understand using Data Studio.
Why is your Google Data Studio dashboard slow?

The performance of the underlying data set may also be the cause of the dashboard’s poor performance. It can also be because of the amount of data being queried by the visualizations in the report and the complexity of those queries. In essence, Google is saying that a report’s poor performance can be caused by a great volume of complex data flowing into it.
Suppose your Google Looker Studio reports are taking a long time to load. In that case, it’s likely that you’re using either the native Sheets connector, your own MySQL, SQL Server, Oracle, or Postgres database, a Google API (like Google Analytics or Google Search Console), or one of the other Partner Data Connectors. The way they are made and the resources used to make them contribute to their slowness.
For instance, Google Sheets is not designed to hold massive amounts of data. While having ‘live’ connectivity to an API like Google Analytics is convenient, the connector wasn’t built to retrieve huge amounts of data quickly. When you run a query that already-existing data can supply, Data Studio nevertheless returns to the original data source, discarding all of the previously-arrived data, because it is not built to cache the results intelligently.
Making Google Looker Studio Faster
Here are ways to speed up your Google Looker studio,
Use pre-processed Data Sources
We recommend using a data source that contains processed data to speed up your dashboards, instead of processing data in Google Data Studio.
Blending:
Data blending is the process of combining data sets from different sources and devices to get deep insights into customer behavior and journey. With full-funnel blended data you can calculate metrics like acquisition and LTV and use those to distribute your budgets to the best performing advertising channels and campaigns.
Instead of blending your data in Google Data Studio, we recommend using blended tables as your data source. It will dramatically improve the performance of your dashboards. But it requires a deep understanding of marketing data and a good data engineering team to get error free results.
Calculated Fields:
Calculated dimensions and metrics can be used to build new fields depending on the data you already have, such as creating “product groups” based on utm_campaign, utm_term and utm_content, or calculating the engaged user on the amount of pageviews per visit, and other things. This is quite useful, and you should use it, but keep in mind how it has been used.
Our recommendations are as follows:
– In Google Data Studio, use data tables containing calculated fields as your data source.
– Create calculated fields at the chart level (for each individual chart/table/etc.)
Create calculated field on the chart level: choose chart > add dimension/metric > add field
– In Google Data Studio, create calculated fields at the Data Source level. It will prevent calculated fields from being processed multiple times.
Create calculated field on the Data Source level: Resource > manage added data sources > edit > add a field
Flow chart of Data Processing in Google Looker Studio with Single Data Source

Flow chart of Data Processing in Google Looker Studio with Multiple Data Sources

Use the extract connector in Looker Studio
A unique connector for Looker Studio performs significantly differently. Google’s extract data source simply asks for a portion of your data each time instead of all of it. As the amount of data is set, it saves and stores the data in a middle step, speeding up the request. However, this data processing and data freshness have some limits. The 100MB data limit may not be sufficient for detailed, useful reports. Data is updated daily, weekly, or monthly rather than in real time. This means that you cannot maintain real-time automatic reports in the same manner.
Best Practices while using Google Looker Studio
Improving the performance of Google Data Studio can enhance the user experience and efficiency. Here are three ways to make your Google Datastudio runs faster:
1. Optimize Data Source Queries:
- Query Efficiency: Ensure that your underlying data sources are optimized for performance. Write efficient and well-structured queries to retrieve only the necessary data. Avoid unnecessary joins, use indexes appropriately, and consider aggregating data at the source where possible.
- Data Sampling: If your data source contains a large dataset, consider using sampling to retrieve a subset of data for visualization. This can significantly reduce query execution time and improve report loading speed.
2. Limit Data in Visualizations:
- Data Range: Limit the date range of your visualizations to display only the necessary timeframe. This is particularly important when dealing with large datasets over extended periods.
- Data Filters: Utilize filters efficiently to limit the amount of data displayed in your charts and tables. Filters can help focus on specific segments of your data, reducing the overall load on the report.
3. Optimize Report Design:
- Reduce Visual Elements: Limit the number of visual elements (charts, tables, etc.) on a single page. Having too many visuals can increase the rendering time. Consider breaking down complex reports into multiple pages or dashboards.
- Use Aggregated Data: Instead of displaying raw, granular data, use aggregated data where appropriate. Aggregating data at the visualization level can reduce the amount of information to be processed and improve rendering speed.
Additionally, ensure that your internet connection is stable and that your browser is up-to-date, as these factors can also influence the speed of Google Looker Studio. Regularly check for updates and new features, as Google may release optimizations to enhance the overall performance of the platform.
Final Words
Looker Studio is an excellent tool. It’s excellent for marketing departments, agencies, and anyone else who wants to analyze and visualize data. But when a tool doesn’t work as well as you’d like it to, it may be really annoying. We hope that these pointers have assisted you in speeding up your Looker Studio dashboards and reports so that you can spend more time analyzing your data and applying it to have a positive influence and less time waiting for a loading screen.
Bonus Read: How EasyInsights works with First-Party Data for Data Activation and Enrichment
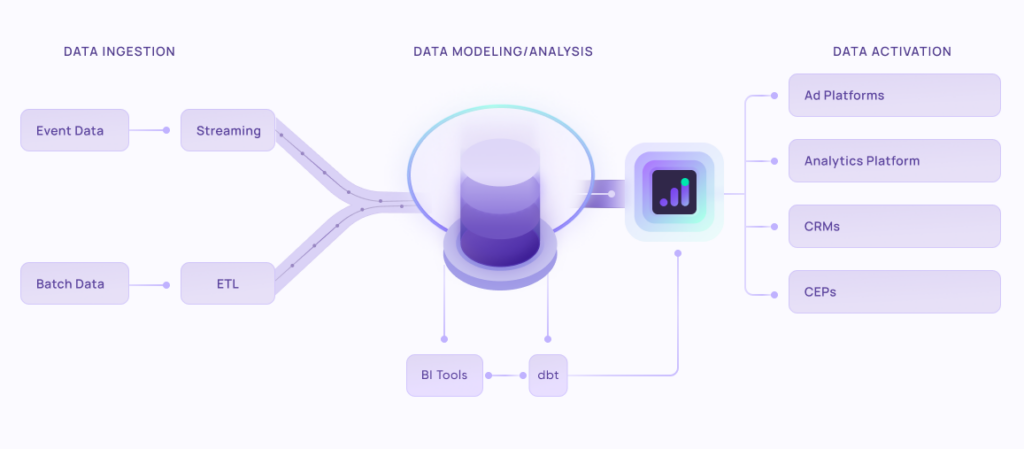
EasyInsights works with raw marketing data for data activation and data enrichment in a few key ways:
Data Collection and Transformation:
- EasyInsights connect directly to your martech stack allowing it to access and extract the raw data you’ve collected.
- Data Transformation: EasyInsights then cleans, normalizes, and enriches the data to make it usable for activation purposes. This may involve tasks like:
- Formatting data: Ensuring all data points are in a consistent format.
- Handling missing values: Filling in missing data points or removing them according to your preferences.
- Enriching data: Adding additional data points from other sources to create a more comprehensive picture of your customers.
Data Activation:
- Segmentation and Targeting: It allows you to segment your audience based on various criteria like demographics, behavior, and interests using the enriched data.
- Multi-channel Marketing: You can then use these segments to activate your audience across different marketing channels like email, social media, and advertising platforms.
- Customer Relationship Management (CRM): The data can be used to personalize outreach and interactions with customers within your CRM system.
- Marketing Attribution: EasyInsights can help you understand how different marketing channels contribute to conversions and optimize your marketing spend accordingly.
Key Feature:
- Offers features like customer data platform (CDP) capabilities, marketing automation, and campaign management tools.
- Focuses on reverse ETL (extracting data from your warehouse and sending it to marketing tools) and offers pre-built integrations with various marketing platforms.
EasyInsights is a marketer’s preferred tool for first party data activation.
In this age of cross-channel marketing, EasyInsights offers a comprehensive platform to collect, store, and transform all your first-party data.
EasyInsights enhances marketing campaign efficiency in a cookieless landscape with accurate ad signals. It helps brands step away from surface-level metrics and unleash the potential of first-party data to optimize marketing strategies, ensuring a superior Return on Ad Spend (ROAS). It does all this, while being a highly affordable no-code platform with an exceptional customer support apparatus.
Sign up for a demo today to see EasyInsights in action.