

Reporting is an important element of marketing analytics, for it helps you keep track of your performance. Since marketers run multiple campaigns across channels today, manually aggregating your data and creating reports is a hassle. That’s when marketers turn to tools like Power BI.
As evident from the name itself, Power BI is a business intelligence tool used for collecting, modeling, and visualizing data for analysis and interpretation. It can also help you streamline and automate your reporting workflow.
So, let’s explore what all Power BI has to offer to marketers. We will also walk you through the steps to create your first visualization in Power BI. Read on.
Jump ahead to:
What Power BI is used for?
Power BI is Microsoft’s business intelligence and data visualization tool. It allows users to integrate different data sources, transform and model that data, and create interactive visualizations for their reports. You can also collaborate on reports with other users and share your reports with your colleagues.
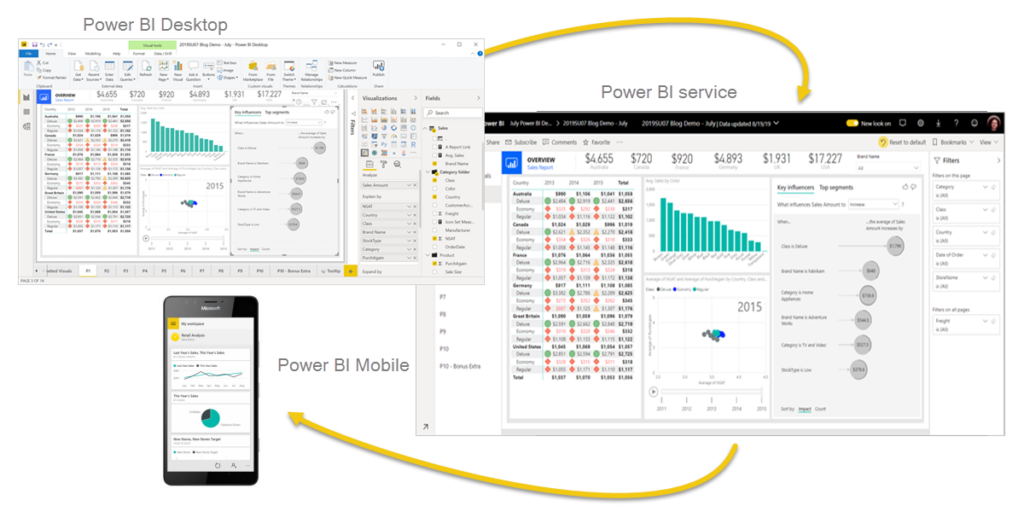
MS Power BI is available in three versions:
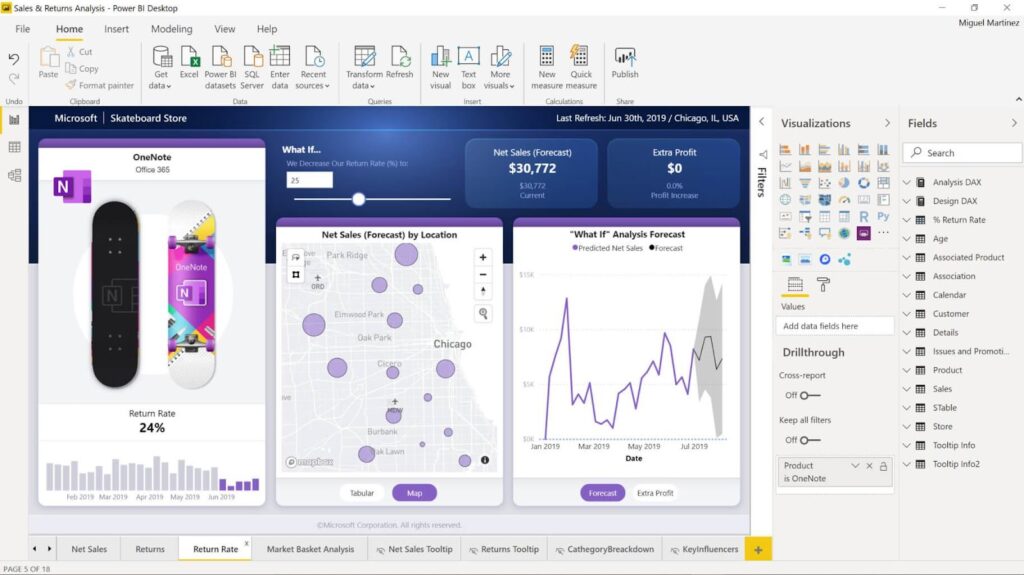
1. Power BI Desktop
Power BI Desktop is the original and complete version of Microsoft’s business intelligence tool. It is a free application available on Microsoft Store and website, but it natively runs only on Windows devices.
The software supports all popular data sources and file formats. It offers plenty of visualization options for interactive reporting. The included Query Editor also lets you combine data from multiple sources to create comprehensive data models for reporting.
2. Power BI Service
Power BI Service, on the other hand, is a cloud-based service designed primarily for editing reports and sharing them across the organization. Being a SaaS application, it is accessible via web browsers like MS Edge, Chrome, and Safari. And available features depend on your license tier.
Even though it can connect multiple sources, the supported sources are fewer in number than the desktop version. Similarly, it also cuts down on the modeling capabilities it offers.
3. Power BI Mobile
Power BI Mobile is an app available for Android, iOS, and iPadOS devices. It is solely for viewing reports on the go. It provides a mobile and touch-optimized layout for navigating dashboards and reports on a smaller screen.
Microsoft Power BI Pricing – All Plans
Power BI Desktop is free to use but does not offer collaborative features. For that, you will need a paid subscription. There are two subscription plans available:
1. Power BI Pro
The Pro plan gives you access to a complete business intelligence toolset along with Power BI cloud service. It starts at $9.99/month per user.
2. Power BI Premium
Power BI Premium plan unlocks enterprise-level analytics and reporting tools starting at $20/month per user.
Key Features of Power BI
Here are some useful features you get with Power BI:
1. Data Connectivity
Power BI allows you to collect data from various sources, be it applications, SQL databases, website analytics tools, CRM tools, email automation platforms, etc. You can also import datasets in various file formats, including XLSX, CSV, JSON, XML, and PDF.
2. Data Transformation and Modelling
After you have linked data sources with your Power BI installation, you can clean, group, and transform data. You can merge columns, filter desired information, add calculated columns, and prepare your data for reporting.
The tool also allows you to model your collected data and define relationships between multiple tables, allowing for more comprehensive reporting.
3. Plenty of Visualization Options
Power BI offers numerous visualizations like bar graphs, line charts, pie charts, maps, etc. These visualizations are interactive and customizable. You can arrange them in different layouts on a single canvas so reports are not only extensive but look visually appealing as well. Apart from that, you can access more visualizations from the community and developers available on MS AppSource.
4. Real-Time Reporting
Power BI also supports data collection from sources in real-time. As a result, you can create dashboards to keep track of vital metrics that update data in real-time.
5. NLP-Based Assistive Features
The tool also comes with natural language processing capabilities, which you can leverage to explore your data in Q&A format. You can enter prompts asking questions about your data. And Power BI returns suggestions and answers. You can also create summaries of your visualizations in one click.
Using Power BI in Digital Marketing
Power BI has plenty of use cases for marketers that are worth exploring. Let’s have a look at a few of them:
1. Bird’s Eye View of Marketing Performance
Marketers use various tools to monitor marketing efforts on different channels or platforms, such as SEO, PPC, and CRM. However, these tools often have siloed reports, making it difficult to consolidate performance across channels and gain a 360-view of marketing performance.
As mentioned earlier, Power BI allows you to create reports using data from multiple sources. It even collects data in real-time. So, you can create a single dashboard that continuously reports on every vital KPI you select for each marketing platform.
2. Benchmark Growth
Power BI is a centralized repository of all your marketing reports. You can benchmark your present performance by comparing them with reports from the past. Similarly, you can import competitor data, visualize it, and compare it with your performance. As a result, you can better identify gaps in your performance and take measures to fill them.
3. Prepare Easy-to-Interpret Reports
As a marketer, you aren’t only responsible for bringing results but also explaining them to leaders and other stakeholders. But numbers and charts can often be a bit vague for people who may not be in tune with your marketing efforts.
However, with Power BI, you can use interactive visualizations to create easy-to-interpret reports. Besides, you can also use built-in summarization and analysis features to add key insights for every visualization in your report automatically.
Basics of Power BI
Before you can leverage Power BI for reporting, you must have some prerequisite knowledge. Let’s walk you through some essential functions of Power BI so you can use the platform to its full potential.
1. Relationships in Power BI
In Power BI, relationships refer to the associations established between two or more data tables in a data model. The relationship defines how data in a table relates to the data in another table.
Relationships are important because if your report needs to be based on data from multiple tables, you can establish meaningful connections between them. As a result, you do not have to combine data individually for every filter and visualization you create.
2. Cardinality
To build meaningful relationships, you must understand the concept of cardinality, i.e., the number of elements in a group. In Power BI data modeling, cardinality defines the nature of relationships between data tables. There are three types of cardinalities in Power BI modeling:
- One-to-One: The one-to-one cardinality shows that every value in a column of one table corresponds to a unique value in a column of another table.
- One-to-Many: This type of cardinality indicates that every value in a column of one table relates to multiple values in the column of another table.
- Many-to-Many: This cardinality shows that multiple values in the column of one table can be related to multiple values in the column of another table.
3. Bridge in Power BI
A many-to-many relationship is quite complex and may not always deliver accurate results. In such cases, there’s another solution called a bridge table.
Suppose you have two tables, Table X and Table Y, with a many-to-many relationship. But instead of defining the relationship directly between their values, you create a third table, the bridge table. It contains values from Table X and Table Y, connecting both tables. As a result, it is much easier to establish many-to-many relationships and gain accurate insights from your data.
4. Cleaning Marketing Data on Power BI
Power BI also allows you to clean and transform imported data. You can perform all basic data cleaning steps like editing column names, removing rows, modifying column datatypes, and replacing cell values. But Power BI allows for some advanced data transformation as well. They are:
- Group By: You can group rows of a table based on one or more columns. You can also perform functions like sum, average, count, etc., on the grouped rows.
- Unpivoting: Power BI also allows you to unpivot your data, i.e., to convert columns into rows. It is helpful when you import data in the form of pivot format. You can transform the data into a tabular form. When you unpivot data, Power BI turns columns into attributes and displays their actual values in a corresponding column called values.
- Split by Delimiter: Split by Delimiter function allows you to split a column that contains long strings of data based on a delimiter such as comma, space, colon, etc. You can also choose whether to split the column from the right side or the left or for every occurrence of the specified delimiter.
5. Custom Column Creation
Another Power BI function that will be useful in your marketing analytics is the ability to add custom columns. There are three ways to add new columns to your data in Power BI:
- Custom Columns: Custom columns are beneficial when you must add derived metrics, aggregations, and calculated fields based on existing data to your Power BI table. You can select any of the existing columns, enter the PowerQuery formula, and name your custom column. Power BI will highlight any issues with the formula’s syntax so you can review and correct it.
- Conditional Columns: You can also add columns based on conditions. You have to select a column, define an If-Else like condition, and assign a value, and a new column will be added to your data. The condition can include an operator like equals, begins with, contains, etc.
- Column from Example: The Column from Example option allows you to enter an example of the final output you wish to see in the new column. Power BI then detects all such instances and creates a preview of the new column.
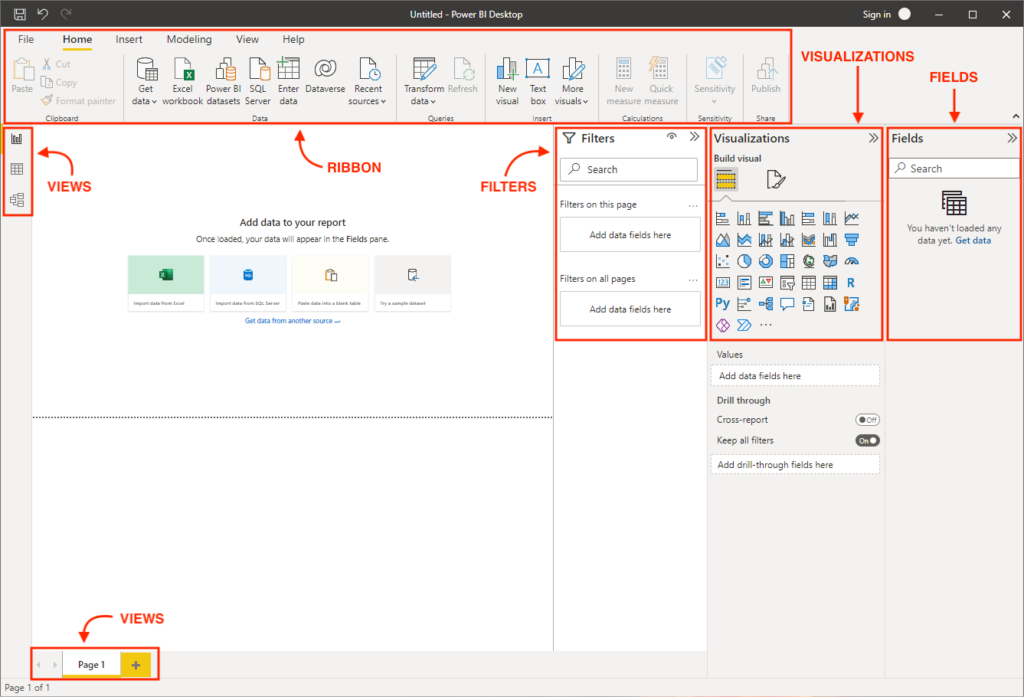
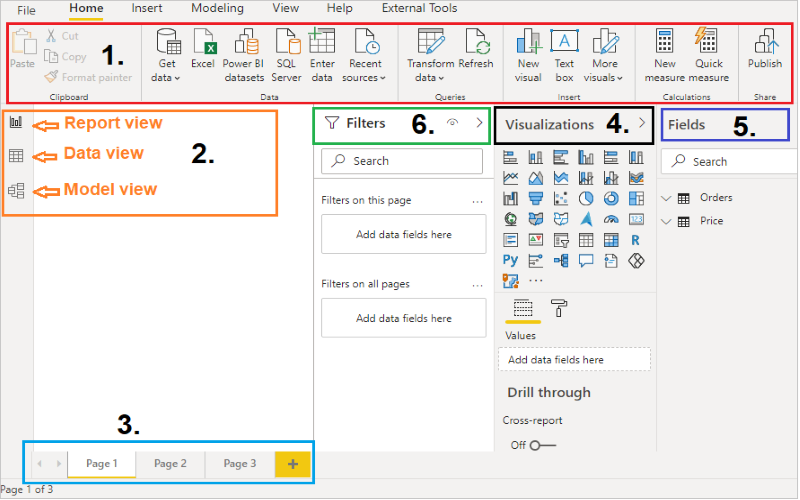
Navigating Power BI
The snapshot below is your guide to navigating Power BI’s user interface.
Getting Started with Power BI
Now, let’s help you set up Power BI on your system:
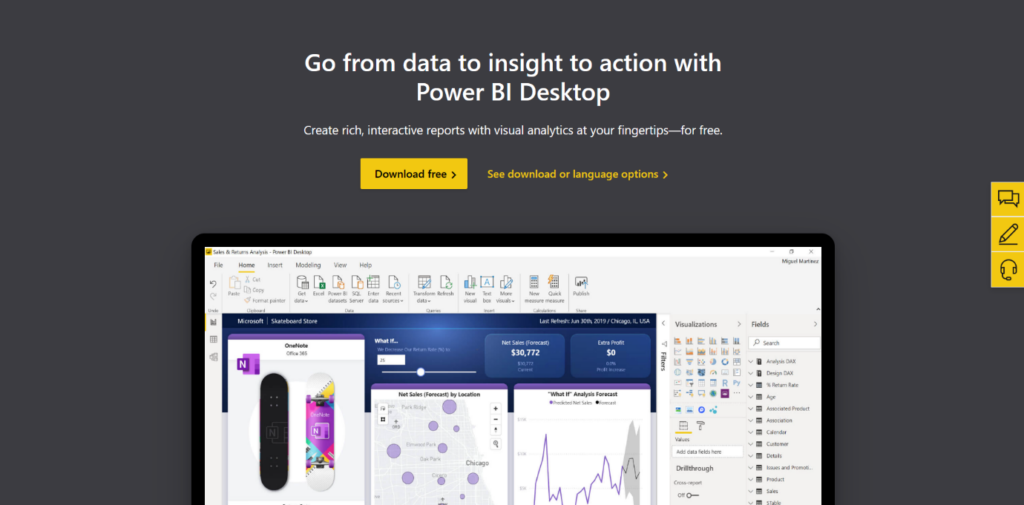
1. Download Power BI Desktop and Sign Up
Power BI Desktop natively runs only on Windows devices, so make sure you have one of these devices. Then, head over to Microsoft’s Power BI download page, select your preferred language, and download the setup.
Run the downloaded setup, follow the prompts, and install the application. Alternatively, you can install the application from the Microsoft Store.
You do not need to sign up with an email to use Power BI Desktop. However, if you decide to create an account, you will need an organizational email. Now, open the application and move on to the next step.
2. Connect Your Data Sources
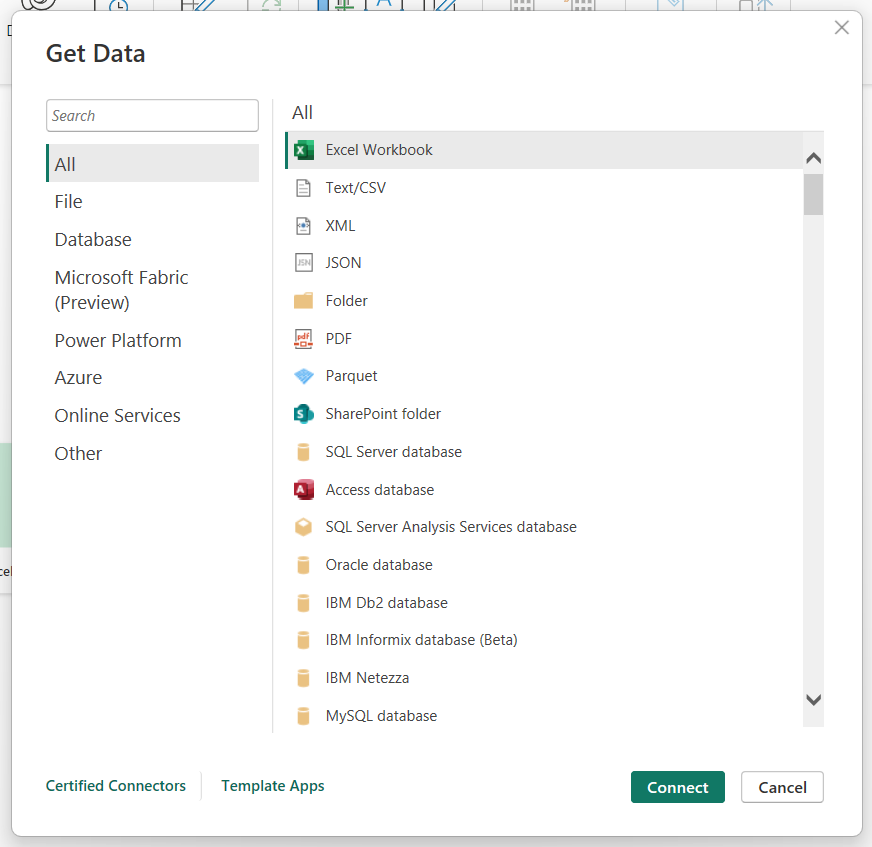
When you boot Power BI, you will see a welcome pop-up dialog. From there, click Get Data. Then, you will see the Get Data dialog with a list of various sources you can connect.
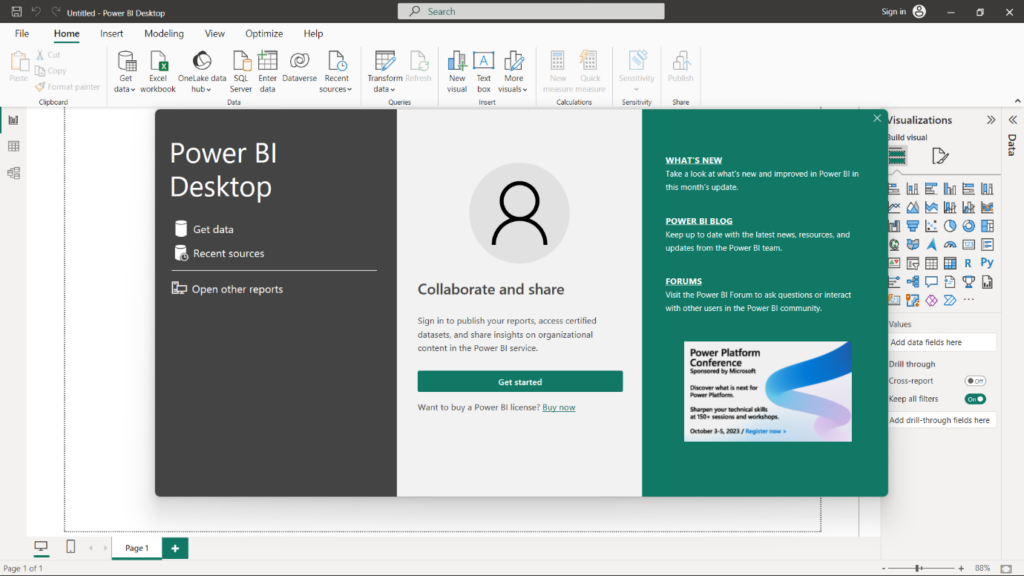
You can import files stored on your hard disk in formats like XLSX, CSV, JSON, LOG, etc. You can also link sources like SQL databases, Azure databases, and online services such as Google Analytics 4, Adobe Analytics, Hadoop, etc.
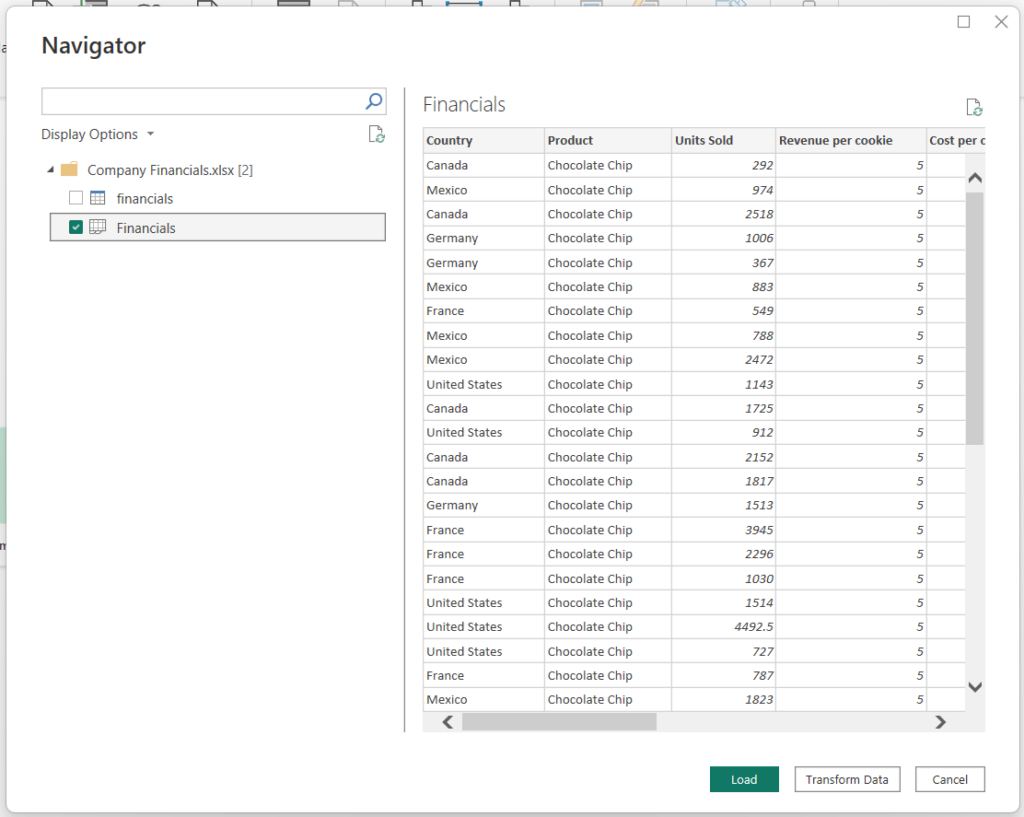
Here, we have taken an Excel spreadsheet with sample financial data for a cookie company. It contains data like product name, revenue, profits, units sold, country of operations, etc.
3. Data Transformation in Power BI
Once you have selected a dataset, you can transform it before moving on to visualization. In the Navigator window, select the dataset and click Transform Data.

Now, you’ll see the Power Query Editor window before you. Here, you can add/remove columns, group/split columns, edit cell entries, remove duplicate entries, and change datatypes.
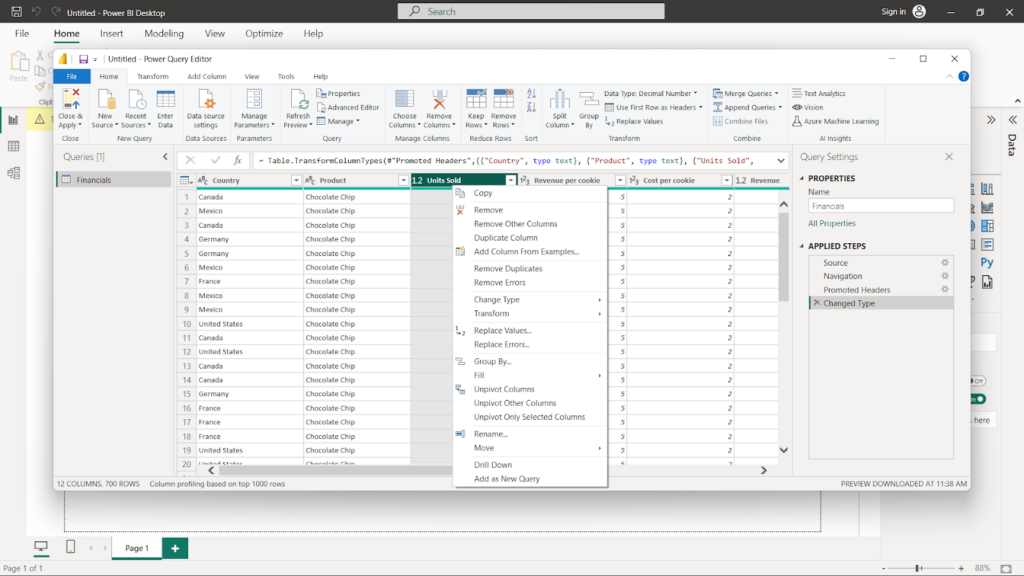
Apart from that, you can also import more datasets and define relationships between different datasets.
To add a new data source, click New Source in the Ribbon menu and pick a source, as shown earlier. You can even paste a URL from the web with data. Once the file is added, you can transform it as well.
This time, we have imported a CSV file with world population data.
Additional Read: 3 Ways to Connect Power BI with Postgres
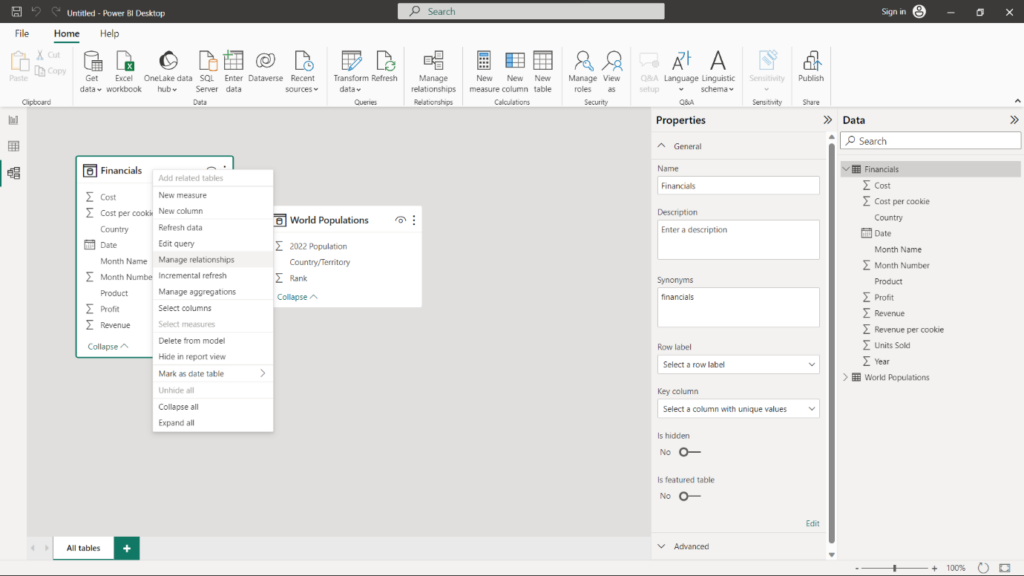
4. Combining Datasets in Power BI
To combine both datasets, head over to the Model View. Click the three dots for the first table and select the Manage Relationship option in the context menu.
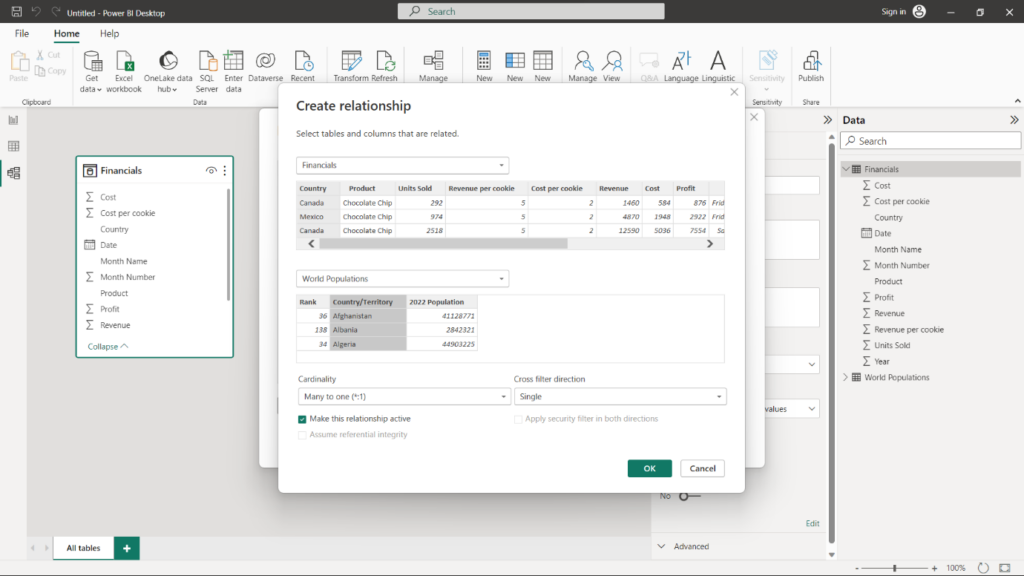
Then, click New to create a new relationship. Select a column in the first table for which you want to define a relationship. Then, select the column you want to connect in the second file. Click OK.
5. Create Your Marketing Reports
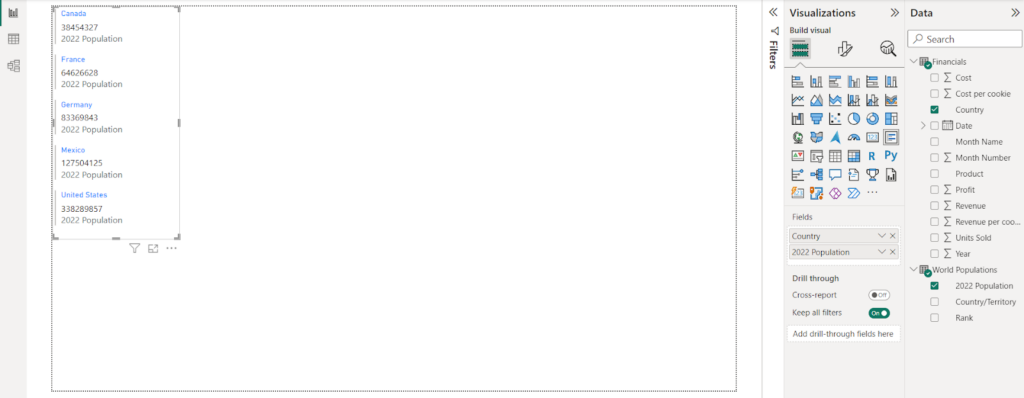
After you have imported data, modeled it, and defined relationships, you can move on to creating visualizations. To add a visualization, pick one from the Visualizations tab. As for data, tick the columns you want to visualize in the Data tab.
Let’s visualize data from the two files we imported earlier. Suppose we want to display the population of countries the company operates in. For that, we will select a Multi-Row Card. Then, we will pick the Country column from the Financials table and the Population column from the World Population table.
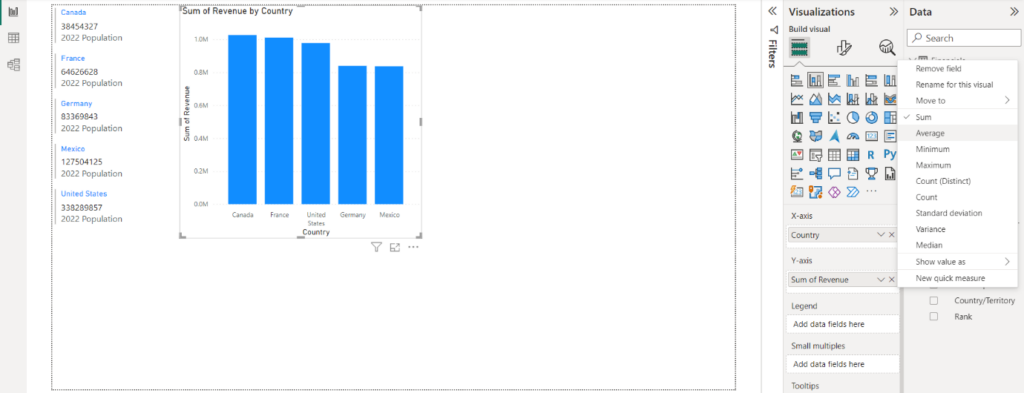
Now, let’s add a bar graph to visualize revenue by country. We will add a bar chart from the visualization list and Country and Revenue columns from the Financials file.
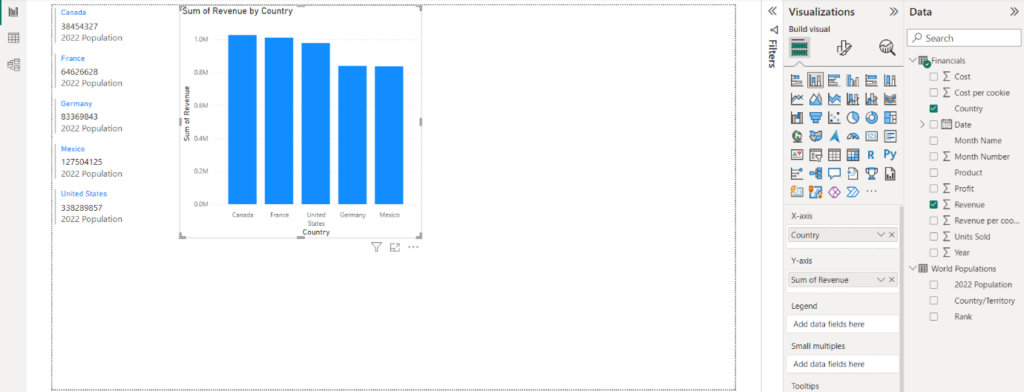
By default, Power BI shows the Sum metric, but you can select different calculations for both the X- and Y-axis.
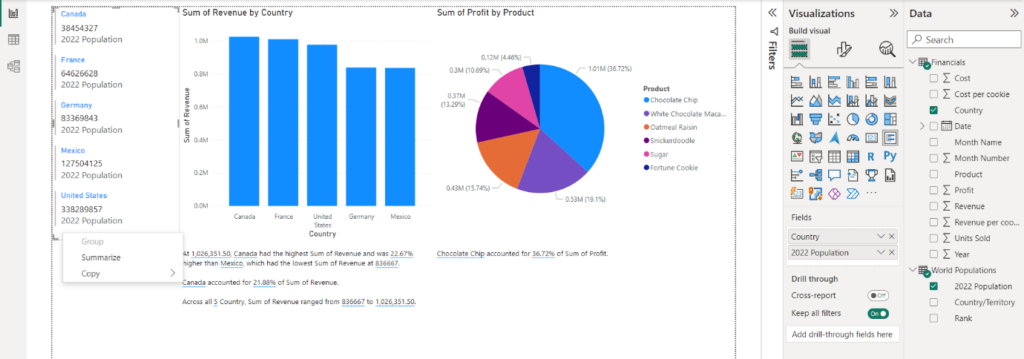
Similarly, we can also add a pie chart. But this time, let’s visualize data for profits earned by the sale of each product in our catalog. We will add a pie chart and select Product and Profit columns for our report.
Another handy feature of Power BU is the automated summarization of your visualizations. Simply right-click on a figure and select Summarize. You will have a summary of the highlights of your data.
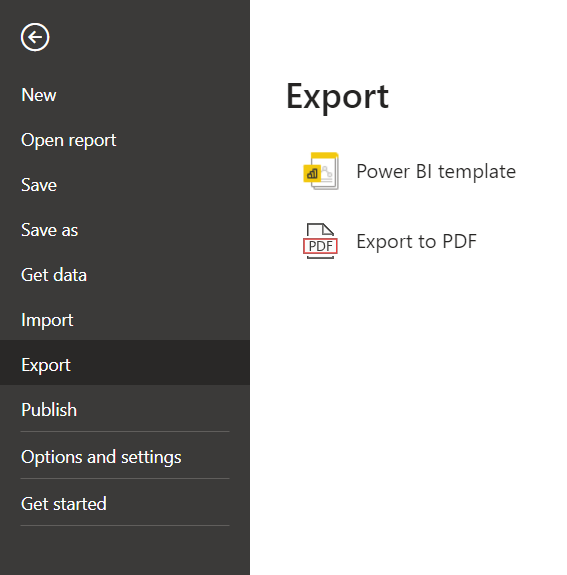
6. Export Your Report
Once your report is ready, you can export it for sharing. Click File > Export. You can export your report in two formats – Power BI template (.PBIT) and PDF file.
Exporting your report as a template is ideal if you plan to open the report in the Power BI app on different devices. On the other hand, a PDF file is better for publishing and sharing a report for viewing.
However, it is important to note that the “.PBIT” file only stores the report’s data schema, not the actual data. If you want your file to store the data, press CTRL+S and save your report as a simple Power BI file with the “.PBIX” extension.
Bonus Read: How EasyInsights works with Raw Marketing Data for Data Activation and Enrichment
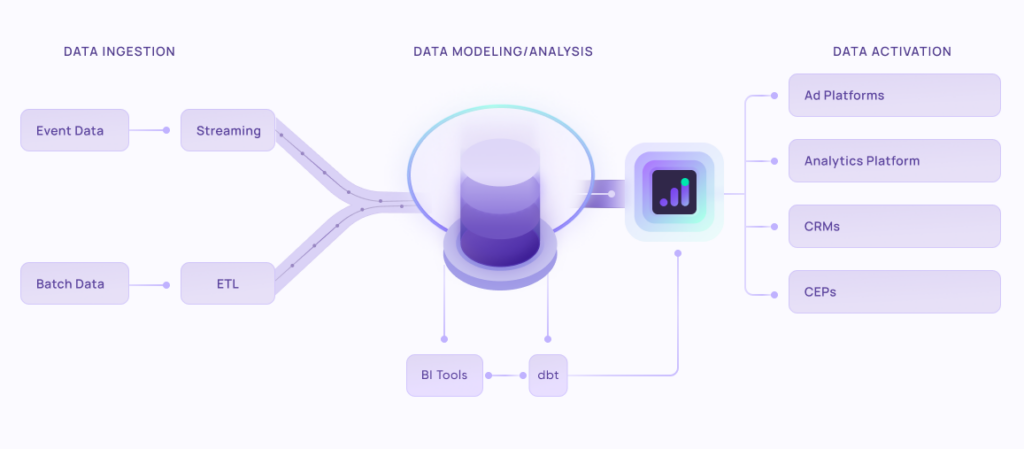
EasyInsights works with raw marketing data for data activation and data enrichment in a few key ways:
Data Collection and Transformation:
- EasyInsights connect directly to your martech, allowing it to access and extract the raw first-party data you’ve collected.
- Data Transformation: EasyInsights then cleans, normalizes, and enriches the data to make it usable for activation purposes. This may involve tasks like:
- Formatting data: Ensuring all data points are in a consistent format.
- Handling missing values: Filling in missing data points or removing them according to your preferences.
- Enriching data: Adding additional data points from other sources to create a more comprehensive picture of your customers.
Data Activation:
- Segmentation and Targeting: It allows you to segment your audience based on various criteria like demographics, behavior, and interests using the enriched first-party data.
- Multi-channel Marketing: You can then use these segments to activate your audience across different marketing channels like email, social media, and advertising platforms.
- Customer Relationship Management (CRM): The data can be used to personalize outreach and interactions with customers within your CRM system.
- Marketing Attribution: EasyInsights can help you understand how different marketing channels contribute to conversions and optimize your marketing spend accordingly.
Key Feature:
- Offers features like customer data platform (CDP) capabilities, marketing automation, and campaign management tools.
- Focuses on reverse ETL (extracting data from your warehouse and sending it to marketing tools) and offers pre-built integrations with various marketing platforms.
EasyInsights is a marketer’s preferred tool for first party data activation.
In this age of cross-channel marketing, EasyInsights offers a comprehensive platform to collect, store, and transform all your first-party data.
EasyInsights enhances marketing campaign efficiency in a cookieless landscape with accurate ad signals. It helps brands step away from surface-level metrics and unleash the potential of first-party data to optimize marketing strategies, ensuring a superior Return on Ad Spend (ROAS). It does all this, while being a highly affordable no-code platform with an exceptional customer support apparatus.
Sign up for a demo today to see EasyInsights in action.


