With the sheer vastness of its user base and being a largely free-to-use platform, YouTube is ideal for content creators, marketers, and businesses to find their audiences. But that also means you must compete with millions of other creators on YouTube for your share of the views and watch hours. And to do that, you must master YouTube Analytics.
In this blog we explore what YouTube Analytics is and how it works. We will also look at some tips and tricks you can use to rank better and grow your YouTube channel.
Jump ahead to:
YouTube Analytics Overview
YouTube Analytics is a tool that helps creators and marketers measure how their content performs on YouTube. It gives detailed information about audiences, like how they found the video, how much time they spent on your video, their demographic details, and much more.
Suggested Read: YouTube vs Facebook: Which Is the Best Channel to Generate Leads?
The Way YouTube Rankings Work
YouTube, at present, is like a search engine but for videos. Speaking of search engines, since Google owns YouTube, the ranking works similar to how websites rank on the Google search engine.
YouTube has its own algorithm that recommends videos to its viewers. But is it as good as the Google Search algorithm? Yes. In fact, over 70% of videos watched on the platform are actually recommendations to people by the platform.
Having launched in 2005, YouTube is now a mature platform. Developers have tons of data to help them optimize their algorithm to prioritize quality content. So, when starting with YouTube content, you must understand the nitty-gritty of its algorithm to rank higher organically.
Here’s how the YouTube algorithm works:
1. Quality of Content on YouTube
The primary factor that YouTube considers is the quality of your content. So, what exactly is quality content? On YouTube, quality content is simply a well-made video. In addition, it must have good production quality, nice visuals, and clear audio, and it should be easy to understand for a regular viewer.
2. Topic Relevance on YouTube
The next factor the algorithm checks is the relevance of your video’s topic. When you upload a video, the algorithm analyzes it on many factors to see if your video is relevant. First, it compares the titles, descriptions, and tags against other videos.
Then YouTube takes into account user behavior on its platform. It establishes the relevance of your content based on what users are searching for and watching on YouTube.
3. Metrics based on User interaction
Once the video is up and live on YouTube, the algorithm kicks into the next stage, ranking it based on viewer interactions. It considers metrics like impressions, click-through, views, likes, shares, watch minutes, and subscribers earned to push your content further.
The algorithm also looks at the demography of viewers watching a video and recommends it to similar audiences.
4. Quality Control and Safety Measures on YouTube
YouTube has comprehensive guidelines regarding what content should be promoted on the platform. To ensure fair play for creators, YouTube has provisions like copyright strikes to prevent unoriginal and copied content.
As for viewers, they can report a video or channel. If they do not like a recommendation, they select options like “Not interested” and “Don’t recommend channel,” which tells the algorithm to improve its suggestions.
The sum of these factors decides whether the algorithm will boost or hinder your content’s organic ranking on YouTube.
The Way YouTube Ads Work
The organic ranking isn’t the only way to take your videos in front of your audiences. You can use advertisements to boost your content’s visibility as well.
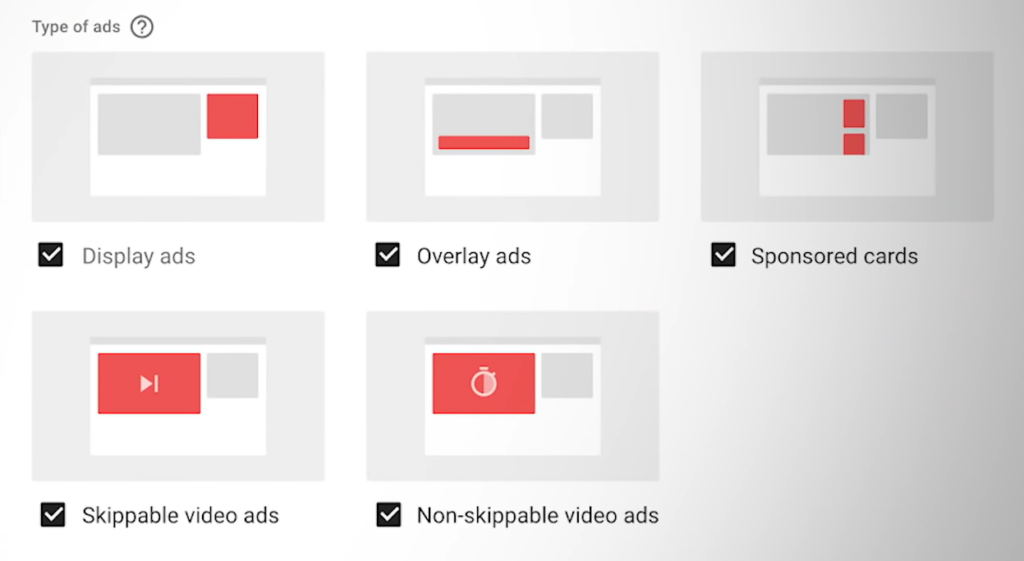
These five types of ads are available on the platforms:
1. Display Ads on YouTube – These ads are shown as a banner on the YouTube website in the top right corner of the browser window.
2. Overlay Ads on YouTube – These ads have translucent backgrounds that pop up on the bottom 20% part of the video.
3. Bumper Ads on YouTube – These are non-skippable ads appearing before a video starts. These ads have a six seconds duration.
4. In-stream Ads on YouTube – These ads appear within a video, i.e., before, during, or after the video. There are two types of in-stream ads:
- Skippable In-Stream Ads: Viewers can skip these ads after five seconds.
- Non-skippable In-Stream Ads: Viewers cannot skip these in-stream ads. These ads usually last 15 seconds or less.
5. Video Discovery Ads on YouTube – These ads appear on the YouTube homepage, search results page, and related videos section.
When you create a YouTube ad campaign, you pick the goal that you want to achieve. These goals include sales, leads, website traffic, brand awareness, and reach. A campaign can have one or multiple goals or no goal at all. You are charged every time a viewer clicks on your ads.
Accessing YouTube Analytics
For your YouTube reporting you only need YouTube Studio, an app for creators by Google. The app is one stop destination for creators to publish and manage their content. And that is where you will find your YouTube Analytics data and reports to track your performance.
To access YouTube Analytics, log in to YT Studio mobile or web app. Once you are in the YT Studio web app, you can access reports in the Analytics tab from the navigation on the left side of your screen.
The Analytics tab has five sections which offer a collection of different reports and metrics for performance tracking. They are as follows:
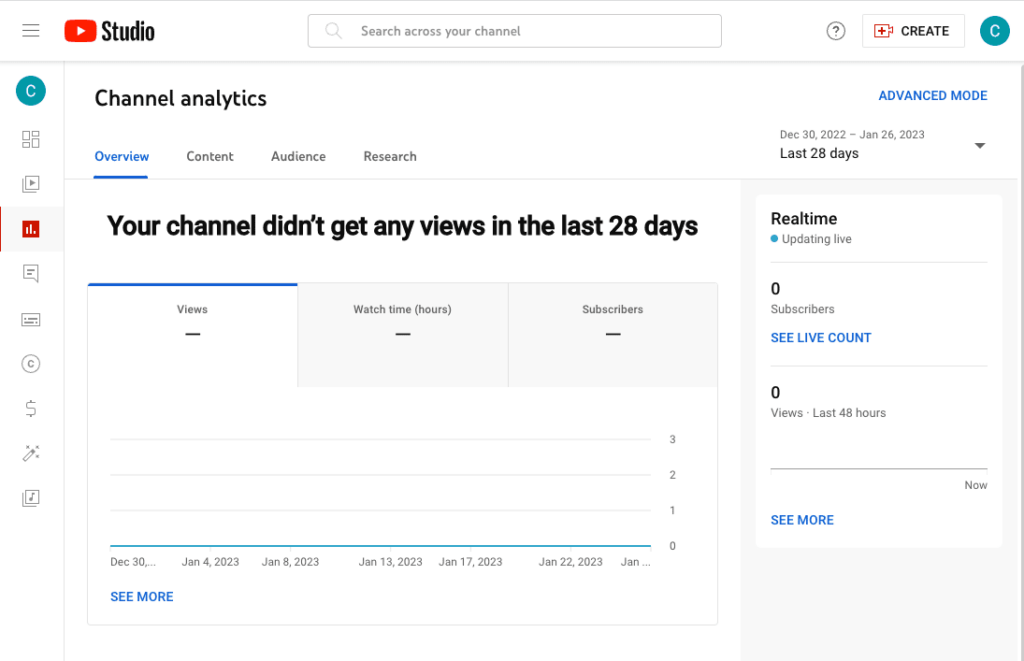
A. Overview of YouTube Analytics
This is your YouTube Analytics dashboard to keep you informed about your channel vitals, like real-time views, total views, watch time, subscribers, etc. It is perfect for getting a performance overview over a period at a quick glance.
B. Content
This is where you get in-depth insights into your content, including regular videos, shorts, and community posts. Here you can see details like which videos get the most views or what was the most viewed part of a video. Similarly, you can analyze which browsers, keywords, playlists, etc., bring views to your channel.
C. Audience
In this section of YouTube Analytics, you can find details about your audiences, like returning viewers, unique viewers, their country, age, and gender. You can also see insights like which other videos and channels are popular among your audiences.
D. Research
This section lets you research the top searches in the last 28 days from viewers on your channel and across YouTube. The research section is there to aid your topic and tag research. You can identify popular topics among your audiences and the keywords they use to find them. So you can decide what topic your next video covers.
E. Revenue
This section becomes available when you reach a certain milestone and join the YouTube Partner Programme. Once you enable channel monetization, you can track your earning and spending on YT ads in this section.
What Are Some Important YouTube Metrics?
Ranking on YouTube also means regularly tracking the performance of your channel and videos. Most people state the number of views to tell a video’s popularity. But there are many other metrics at play when ranking a video. So, these are some metrics that you must prioritize in YouTube Analytics:
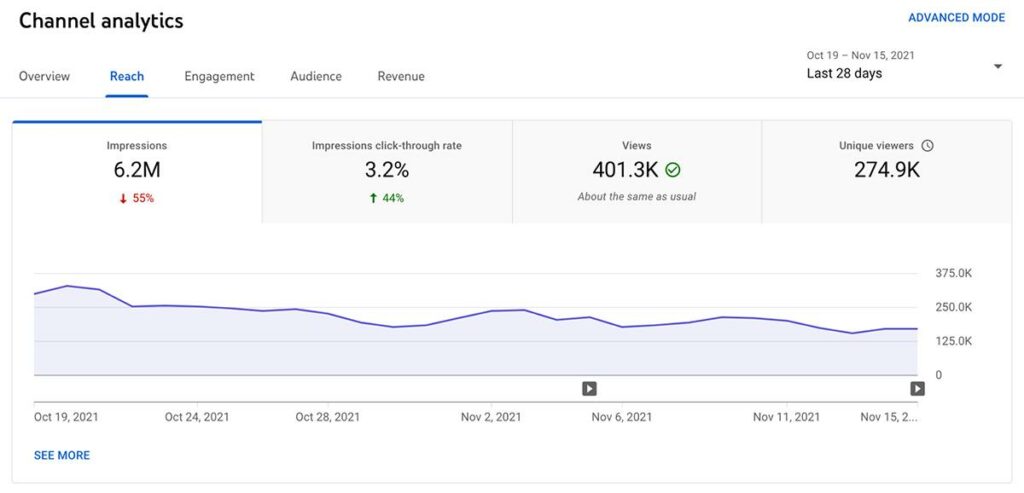
1. Impression Click-Through on YouTube
The impressions metric is the count of occasions your video is displayed on a viewer’s screen. And impressions click-through measures how many viewers actually click on your video to watch it. A higher CTR indicates that your topic choice, thumbnail design, target tags, time of posting, etc., are working.
A healthy impression click-through will vary from topic to topic, category to category. But generally, you are doing great if your videos get a click-through of 2% to 10% regularly.
2. Watch Time as Assessed by YouTube Analytics
The watch time metric measures how many hours your audiences spend watching your content. It helps you assess the quality of content and its ability to retain audiences for longer durations.
The higher the watch time, the more visible your content will be. And the only way to boost watch time is to make engaging content that keeps the audience hooked until the end, or at least for a larger chunk of the video.
It is an important metric since it is an eligibility criterion for a creator to join YouTube’s Partner Programme. Your channel must have around 4000 total watch hours in the last 365 days to be eligible for monetizing your content.
3. Subscribers of your YouTube Channel
Subscribers are followers of your channel. They are not random viewers but people who choose to follow your channel and get notified of new content as you upload it.
Besides watch time, the subscriber count is another factor that decides whether you can join the partner program. You must have at least 1000 subscribers before you can monetize your YouTube channel.
4. Average Percentage Viewed
The average percentage viewed is an important YouTube Analytics metric as it tells you for how long audiences watched a video on average. It measures how well your content retains eyeballs for extended periods.
For instance, you upload an 8-minute video, and most people watch that video for ~2 minutes in total. It means people watched ~25% of the video on average. Any number above 30% is considered a healthy measure of the average percentage viewed metric.
5. Average View Duration
Average view duration shows your channel’s average watch time. It is calculated by dividing total watch hours by the number of plays and replays. This metric helps you identify how long (in seconds) your audiences watched a video.
It is similar to the previous metric but measures the exact seconds on average viewers spend on your video.
6. Measuring Audience Retention with YouTube Analytics
Audience retention is another vital metric, as it helps you measure your content performance at a granular level. This metric lets you identify how many viewers watch or leave at different moments in your videos. The moments include intro, top moments, spikes, and dips.
Audience retention data is available as a line graph for each video. And you can see the retention level at every second in a video. So, you easily identify watch sections of your video that are more engaging and offer value compared to ones that don’t.
For example, a 20-second intro may be too long for audiences, and they may skip forward to the relevant part. It will reflect in the retention line chart as a steep downward line near the intro. We will also see spikes where viewers find more value.
7. Engagement
Next come the engagement metrics, such as likes, comments, and shares. These metrics help you identify if audiences actually engage with your content or if they watch videos and bounce. The higher the count for these engagement metrics, the higher will be the visibility of your content on YouTube.
There is another engagement metric, but you do not want it to be higher on your video. We are talking about the dislikes. Even though the dislike count is no longer visible to viewers, they can still dislike videos they do not appreciate. The count is visible in YT Studio and affects your rankings.
8. Traffic Sources
At last, you must track your traffic sources to your videos. YouTube has one of the most comprehensive visitor traffic monitoring allowing you to see both internal and external sources. In addition, you can identify search engines, keywords, suggestions, and playlists that bring views to your channels.
9. Revenue Per Mille
Once you monetize your channel, you are eligible for revenue from ads played on your videos, channel memberships, super chat & stickers, and YouTube Premium revenue. Revenue Per Mille or RPM shows how much you earn for every 1000 video views that you get on your channel.
It is an important metric, especially if you are a full-time creator looking to earn from your content or at least generate a passive revenue stream.
Even though there isn’t a number or range that can be marked as a decent RPM, you should only aim to improve it with time. You can enable all ad formats, monetize all your content, and enable ads that play in between your videos to earn more RPM.
10. Cost Per Mille
While RPM is for creators, Cost Per Mille (CPM) is a crucial metric for advertisers. If you are advertising your content on YouTube, CPC will help you track the cost of advertising per 1000 ad impressions. It is important to track this metric so you can set realistic budgets for your YouTube advertising campaigns.
Suggested Read: Underrated yet critical trends in advertising for 2023
Improve your Ranking with YouTube Analytics
As we saw earlier, YouTube’s algorithm considers countless factors to decide if a video deserves more eyeballs. So, to ensure that your video gets the needed mileage, you must optimize it.
Let’s look at some ways you can rank better on YouTube. And if you have done SEO for your website content, you will find most of these points a bit familiar.
1. Research Your Tags
Tags are like keywords for YouTube. You can use regular keyword research tools or use YT Studio’s built-in keyword research tool to find tags to use in your videos. As you post more videos, YT Studio will also show keywords that bring traffic to your channel and even individual videos.
2. Optimize Video Titles
The next step is to optimize the title of your videos. The key to writing good titles is to be concise and convey the intent of your videos.
For instance, if you have a travel vlog, mention the location, or if you are reviewing a product, mention the product name. In case you have a tutorial, begin with “how to.”
But to rank higher, your title must also match the search queries of your target audience. So, use tags/keywords in your title as well.
3. Optimize Video Descriptions
Video descriptions are as important as the title if you want to improve your ranking on YouTube. So, put some thought into writing video descriptions that actually offer value to the viewer.
Explain in the first line itself what to expect in a video, as a portion of the description is visible below the title. So, it can increase the chances of viewers clicking on the video.
4. Use Custom Thumbnails
When uploading a video on YouTube, you can pick a still from your video to use as a thumbnail. But you cannot rely on generic thumbnails if you want to rank better.
A thumbnail is like a teaser to your video, so use an image that grabs viewers’ attention. Also, add clearly visible text to state your video’s topic.
5. Add Closed Captions and Subtitles
YouTube has a global audience that relies on subtitles to consume content that is not in their native tongue. And users can filter videos that have subtitles from the ones that do not.
To rank better, you must add subtitles to your videos for the foreign audiences watching your content. Similarly, use closed captions for audiences who have impaired hearing.
6. Create Playlists
YouTube lets you arrange your videos in different playlists. Then, you can share these playlists with your audiences. But how do playlists help with the ranking? As you know, YouTube has an autoplay feature. When enabled, it plays new videos automatically when a video ends.
But when a viewer is in your playlist, YouTube only plays your videos one after the other. So, if the audiences go through many of your videos in a playlist, it is a positive signal for the algorithm to boost your channel’s visibility.
Enhance Your YouTube Ad Performance with EasyInsights
YT Studio is more than enough to help you track your channel’s growth. However, when publishing content across multiple platforms, you will require a better, more advanced analytics platform like EasyInsights.
How EasyInsights can help you work better with YouTube Ad Platform
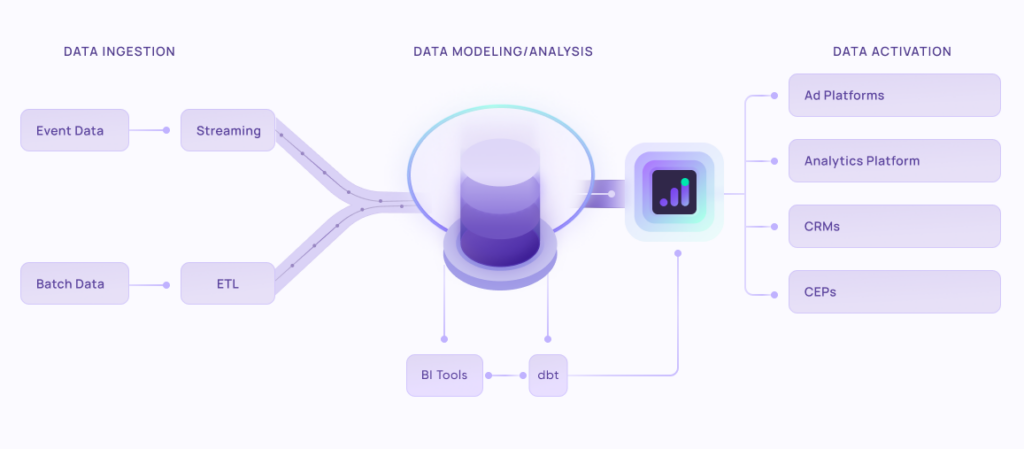
EasyInsights works with raw YouTube data for data activation and data enrichment in a few key ways:
Data Collection and Transformation:
- EasyInsights connect directly to your ad platform allowing it to access and extract the raw data you’ve collected.
- Data Transformation: EasyInsights then cleans, normalizes, and enriches the data to make it usable for activation purposes. This may involve tasks like:
- Formatting data: Ensuring all data points are in a consistent format.
- Handling missing values: Filling in missing data points or removing them according to your preferences.
- Enriching data: Adding additional data points from other sources to create a more comprehensive picture of your customers.
Data Activation:
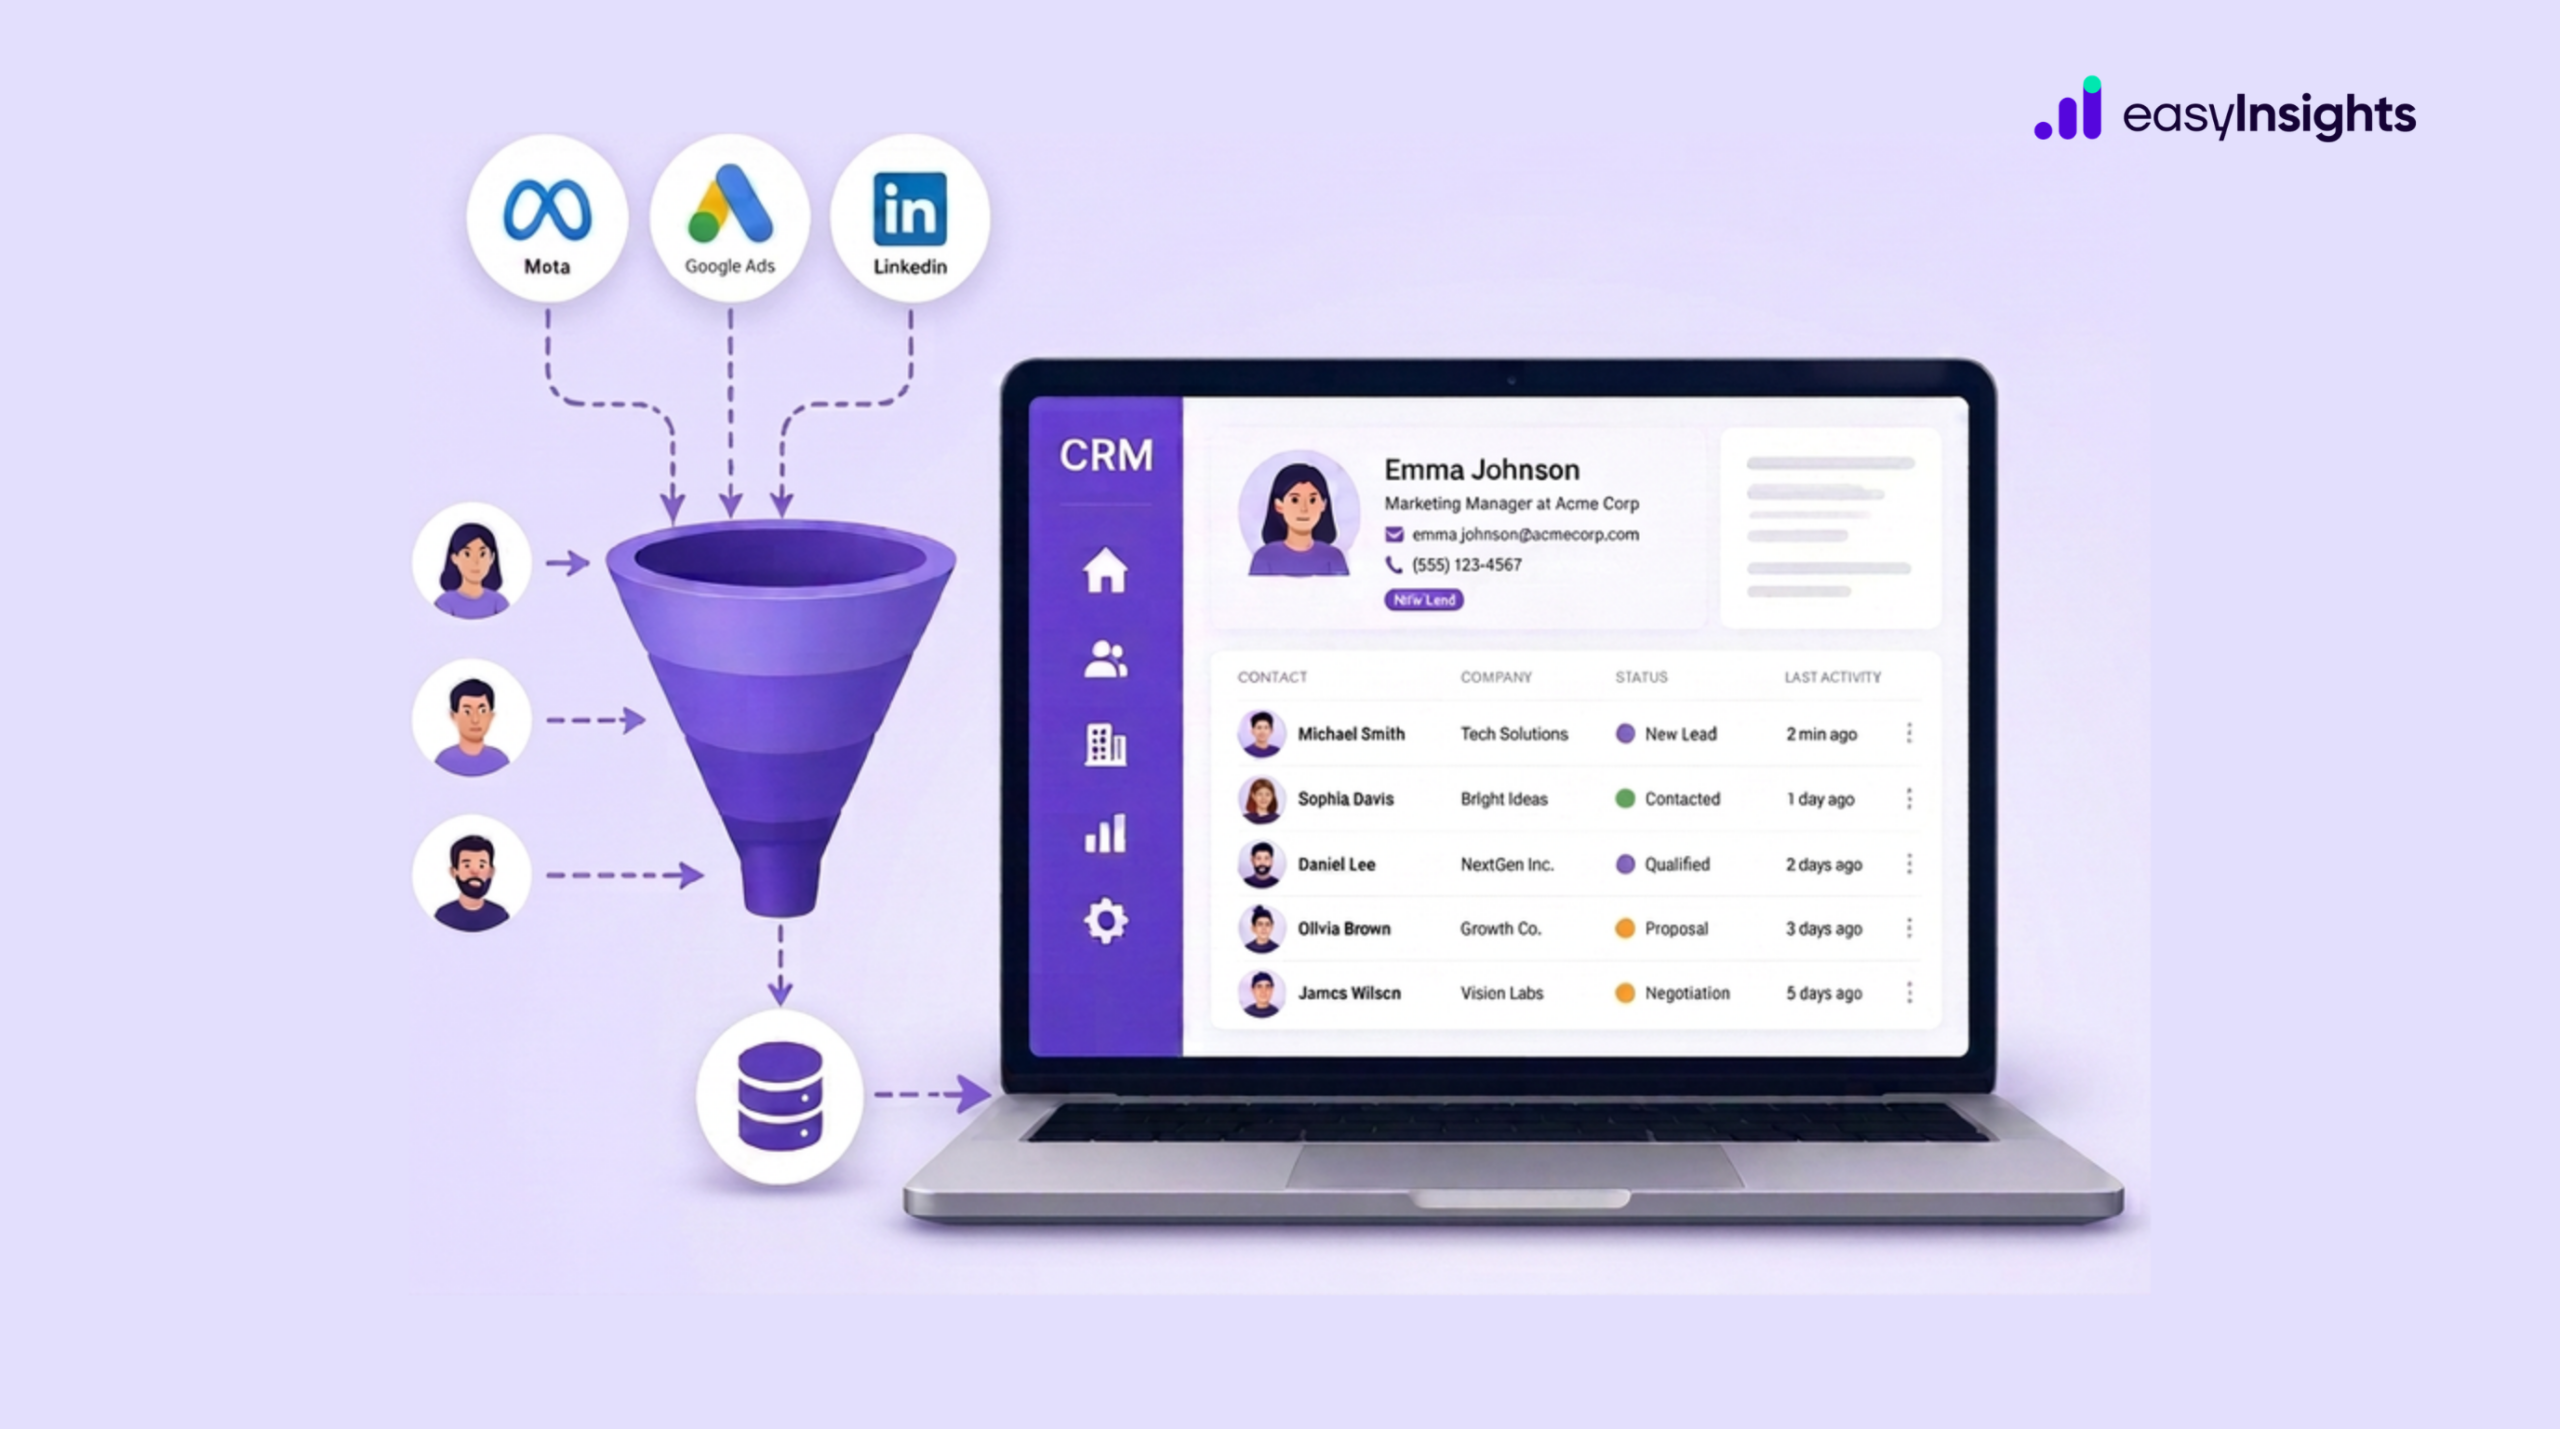
- Segmentation and Targeting: It allows you to segment your audience based on various criteria like demographics, behavior, and interests using the enriched ad platform data.
- Multi-channel Marketing: You can then use these segments to activate your audience across different marketing channels like email, social media, and advertising platforms.
- Customer Relationship Management (CRM): The data can be used to personalize outreach and interactions with customers within your CRM system.
- Marketing Attribution: EasyInsights can help you understand how different marketing channels contribute to conversions and optimize your marketing spend accordingly.
Key Feature:
- Offers features like customer data platform (CDP) capabilities, marketing automation, and campaign management tools.
- Focuses on reverse ETL (extracting data from your warehouse and sending it to marketing tools) and offers pre-built integrations with various marketing platforms.
EasyInsights is a marketer’s preferred tool for first party data activation.
In this age of cross-channel marketing, EasyInsights offers a comprehensive platform to collect, store, and transform all your first-party data.
EasyInsights enhances marketing campaign efficiency in a cookieless landscape with accurate ad signals. It helps brands step away from surface-level metrics and unleash the potential of first-party data to optimize marketing strategies, ensuring a superior Return on Ad Spend (ROAS). It does all this, while being a highly affordable no-code platform with an exceptional customer support apparatus.
Sign up for a demo today to see EasyInsights in action.