Jump ahead to:
An introduction to website analytics
Most businesses these days have a presence online through either a website, social media profiles, newsletters, or all of these digital marketing verticals. And if yours is a business that heavily relies on making sales and conversions through your website, it becomes pivotal to understand all the ins and outs of your website.
This is where website analytics comes in. It helps you collect key data points to interpret how, when, and where visitors are using your website.
Aspects of website traffic analytics
Digital marketers use website analytics to get concrete data that helps them understand the following:
- How many people are using my website?
- Where is my audience from, and how are they reaching my website?
- Which pages are a hit, and which are not working well for me?
- What are the results of the ads I am running on and for my website?
Various aspects of website traffic analytics in the form of valuable data on user psychology, online footprints, and more answer these questions. For example, through website analytics, you can figure out:
- Hits: The interactions of visitors on your website.
- Sessions: The continuous stream of activity on the website or application.
- Users: Selective details on your visitors’ demography, device and browser information, content on your website they like, and more.
- Conversions: Data on successful purchases, sign-ups, etc.
The Google Analytics Tool
The most popular free tool for website analytics, Google Analytics helps you get started with the primary metrics you need to gauge your audience, user behaviour, and conversions.
A diverse tool, Google Analytics helps you with information on the following:
Sources – It tracks the links clicked that led to your website to recognise the source from where the user discovered your business.
Keywords – It helps you learn and incorporate, in your content, the keywords or phrases that users generally use while searching for your business or product category on their search engine.
Segmentation – By different combinations of data segmentation, you can learn user behaviour and more. The user type, their demography, the device they are using to access your site, and the abandonment rate of your site are some segmentations that—when put together in different combinations using different logic—help you target and market more efficiently.
Channels – Google Analytics helps you with data on how your users landed on your website. Whether it was through an organic search, a paid ad, a marketing campaign, a referral link, and so on.
Now that we have a basic idea of website analytics and how Google Analytics operates to help you with valuable information, let’s move on to some of the most important metrics to track on Google Analytics.
5 important metrics to track on Google Analytics
1. Website traffic
Google Analytics helps you gauge how many people are visiting your website. The total number of visitors (termed sessions on Google Analytics) helps you understand how loyal your customer base is. The data on unique visitors (termed users) helps you measure how discoverable your website is to those looking for services in your industry or field. If the number of unique visitors is low, you can run targeted ads to improve your site’s discoverability.
2. Conversion rate
Websites are generally designed to support a purchase, sign-up, reach out, and more. So, are the people visiting your website, clicking the buttons, and improving business for you? The conversion rate in your website analytics tells you how many people went ahead with the purchase, sign-up, or anything else that you wished them to do. In Google Analytics, conversions are termed as “Goals”. So, in a way, it helps you track the percentage of how much you were able to achieve your goals.
3. Landing pages and content
You can measure the top-performing pages on your website using this metric for website analytics. It helps you determine which pages are receiving the most traffic. So, with insight from Google Analytics on your top web pages, you can evaluate aspects such as user experience, the quality of content that users prefer, and the efficacy of marketing campaigns that you run.
4. Bounce rate
Bounce rate shows you the percentage of users who only visited a single page on your website and left it without any interaction. Oftentimes, higher page load time is a major reason for bounces. By measuring the bounce rate, you can analyse if your website is not meeting the user’s expectations in terms of content, aesthetics, or call to action.
5. Average time on the website
This metric for website analytics shows how much time an average user ends up spending on your website. If you are running ads on your website, you are generally aiming for a higher average time on the website, because when the average time on the website increases, so do the chances of getting conversions.
Conclusion
Tracking your website performance is key when you are running a business online, as it is the gateway to the success of your business. With this introductory guide on website analytics, you will be able to pitch the correct strategies for content that goes out on your website and in your campaigns.
Bonus Read: How EasyInsights works with Raw GA4 Data for Data Activation and Enrichment

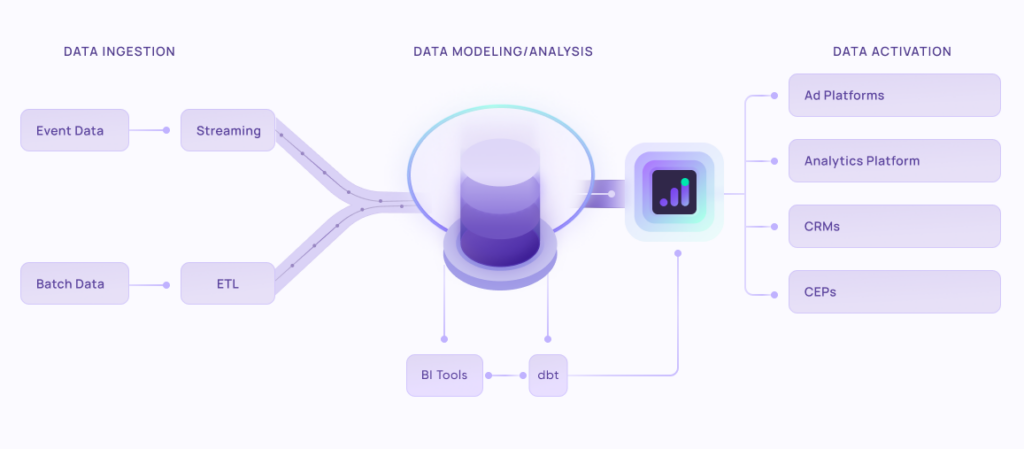
EasyInsights works with raw GA4 data for data activation and data enrichment in a few key ways:
Data Collection and Transformation:
- EasyInsights connect directly to your Google Analytics 4 property allowing it to access and extract the raw GA4 data you’ve collected.
- Data Transformation: EasyInsights then cleans, normalizes, and enriches the data to make it usable for activation purposes. This may involve tasks like:
- Formatting data: Ensuring all data points are in a consistent format.
- Handling missing values: Filling in missing data points or removing them according to your preferences.
- Enriching data: Adding additional data points from other sources to create a more comprehensive picture of your customers.
Data Activation:
- Segmentation and Targeting: It allows you to segment your audience based on various criteria like demographics, behavior, and interests using the enriched GA4 data.
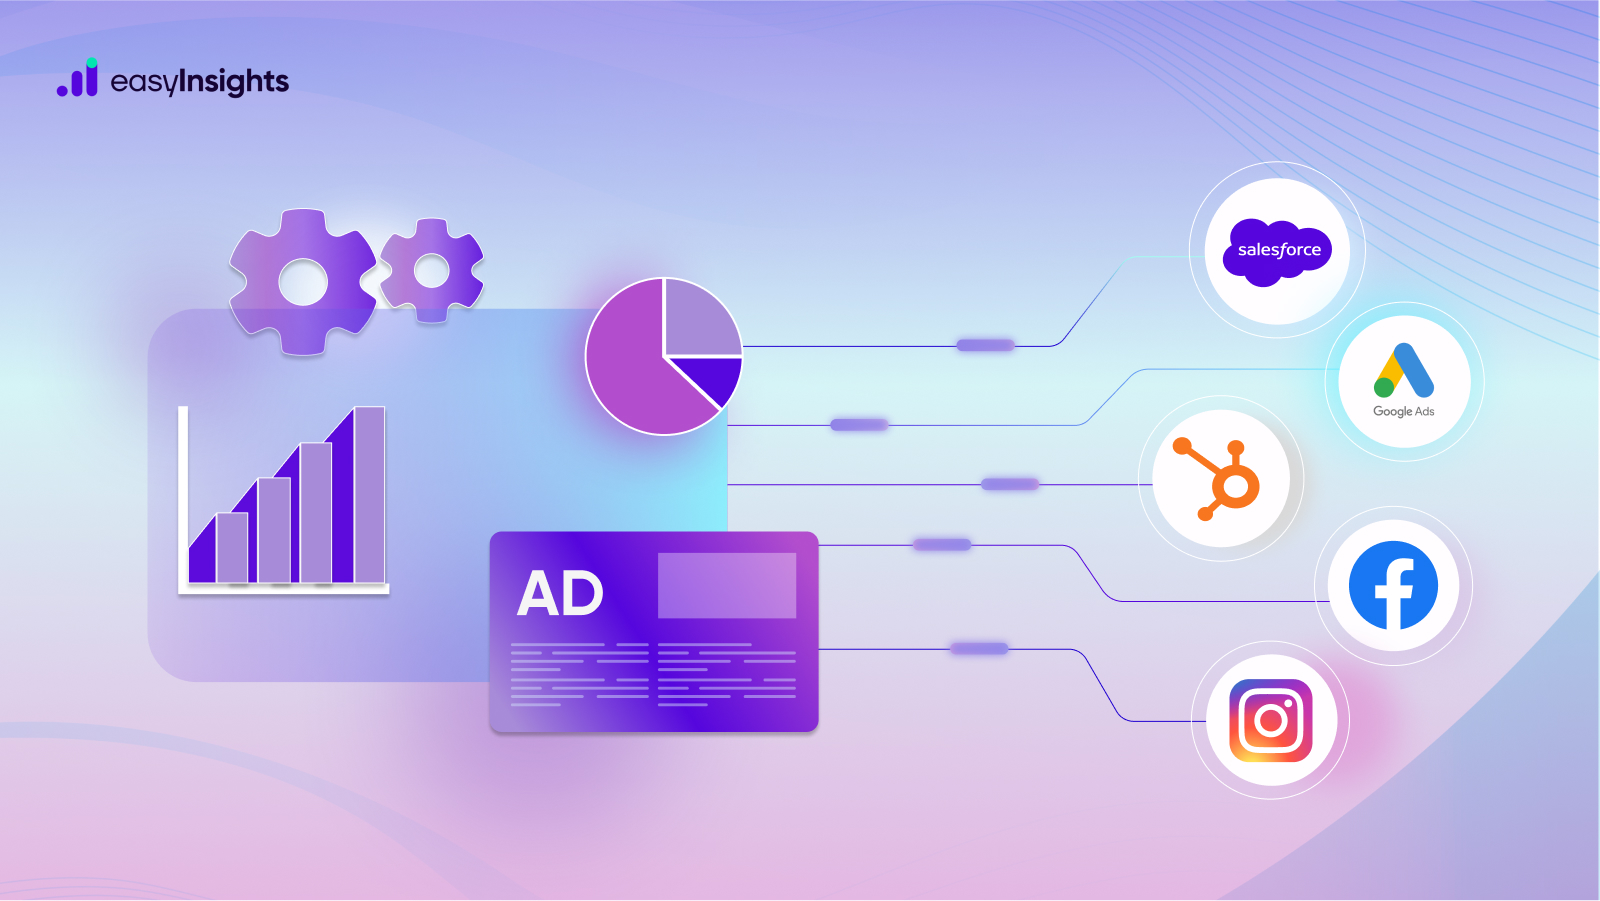
- Multi-channel Marketing: You can then use these segments to activate your audience across different marketing channels like email, social media, and advertising platforms.
- Customer Relationship Management (CRM): The data can be used to personalize outreach and interactions with customers within your CRM system.
- Marketing Attribution: EasyInsights can help you understand how different marketing channels contribute to conversions and optimize your marketing spend accordingly.
Key Feature:
- Offers features like customer data platform (CDP) capabilities, marketing automation, and campaign management tools.
- Focuses on reverse ETL (extracting data from your warehouse and sending it to marketing tools) and offers pre-built integrations with various marketing platforms.
EasyInsights is a marketer’s preferred tool for first party data activation.
In this age of cross-channel marketing, EasyInsights offers a comprehensive platform to collect, store, and transform all your first-party data.
EasyInsights enhances marketing campaign efficiency in a cookieless landscape with accurate ad signals. It helps brands step away from surface-level metrics and unleash the potential of first-party data to optimize marketing strategies, ensuring a superior Return on Ad Spend (ROAS). It does all this, while being a highly affordable no-code platform with an exceptional customer support apparatus.
Sign up for a demo today to see EasyInsights in action.


