eCommerce reports in Google Analytics can help you scale your eCommerce business dramatically. But do you know what’s even more effective? Enhanced eCommerce Reports. What are Enhanced eCommerce Reports, and why are they so special? Well, this is what this blog is all about.
Here we’ll discuss what Enhanced eCommerce Reports are and their types. Also, we’ll talk about what questions each Enhanced eCommerce Report can help you answer about your business. And by the end, you’ll be able to use all the Essential Enhanced eCommerce Reports to scale your eCommerce business.
Jump ahead to:
What is the Google Analytics Enhanced E-Commerce Feature?
If you’re a digital marketeer dealing with an eCommerce business, you must have heard of eCommerce or eCommerce Reports in Google Analytics. This feature provides 5 types of reports regarding sales performance, product performance, transactions, time to purchase, and eCommerce overview.
Similar to the above, enhanced eCommerce is an upgraded version of the eCommerce feature in Google Analytics. When we say upgraded, we mean this feature offers way more data and 10 types of reports that you can use to scale your eCommerce business.
While Enhanced eCommerce offers 10 reports, 4 of them offer the most insightful data. Let’s see what you can learn from them.
4 Essential Enhanced E-Commerce Reports in Google Analytics to Scale your E-Commerce Business
1. The E-Commerce Overview Report
The eCommerce overview report brings you a summary of the following metrics:
- Ecommerce Conversion Rate
- Revenue
- Average Order Value
- Top Sellers (sorted by brand, category, and product)
- Transactions
- Marketing (campaigns, order coupon codes, internal promotions, and affiliation)

What questions does this report help you answer?
- How much revenue your eCommerce business is generating?
- Which products of what brand of what category are generating the most sales?
- What is the average order value of the sales you make?
- What are the hot and cold selling products?
2. Shopping Behaviour Analysis
The shopping behaviour analysis report shows different stages of your purchase funnel and how the users moved from one stage to another. Here are the stages it covers:
- All Sessions: In this stage, the people visit your eCommerce website and may start shopping.
- Product View Sessions: This is the stage when people view the products.
- Add to Cart Sessions: This is the stage when people add products to their carts.
- Check-out Sessions: This is when the people check out on your website.
- Transaction Sessions: This is the stage when people make purchases.
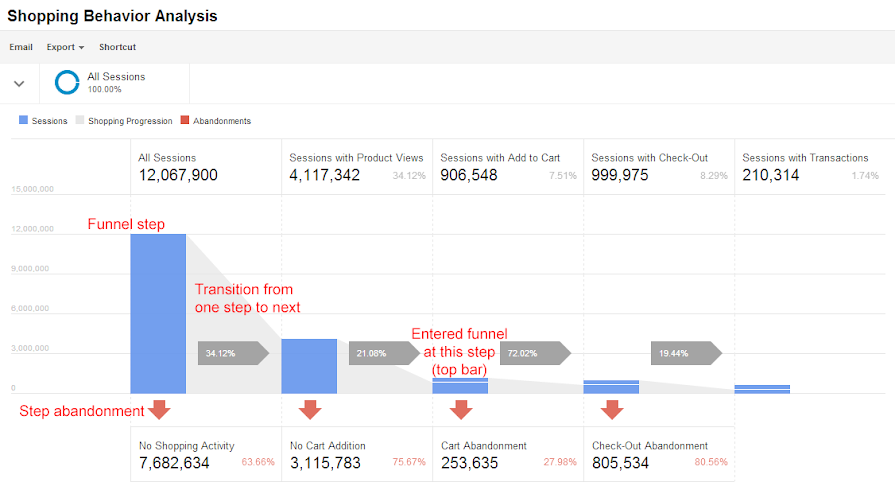
The above chart shows what shopping behaviour analysis looks like.
All sessions in the shopping behaviour analysis report are shown in blue colour. The shopping progression or movement of people from one shopping stage to another is shown in grey colour.
The abandonment of each stage by the users is shown via a red-coloured downward arrow. Abandonment happens when a person leaves any stage of the funnel. For instance, if a person adds the product to their cart and closes the website, it will count as abandonment.
What questions does this report help you answer?
- How users are moving from one stage of the shopping funnel to the other stages?
- Where the users are abandoning the shopping funnel?
- How many users abandoned a session?
- How many users reentered the session?
3. The Sales Performance Report
The sales performance report helps evaluate sales via:
- Date
- Transaction (transaction id, date, and time)
Here is the metrics sales performance report includes:
- Refund Amount (amount refunded for transactions)
- Revenue
- Quantity (number of products/units sold)
- Shipping (total shipping expenses for eCommerce transactions)
- Tax (including taxes for eCommerce transactions)
What questions does this report help you answer?
- How much revenue is your business making?
- How many units have you sold?
- What taxes and shipping charges are you paying?
4. Product Performance Report
As the name says, this report tells you about the performance of your product. However, it considers two points of view which are:
1. Shopping Behaviour:
The metrics it includes:
- Sales Performance
- Product Detail Views
- Product List Views
- Unique Purchases
- Product Adds (to carts)
- Product Check-outs
- Product Removes (from carts)
- Shopping Behaviour
- Cart-to-Detail Rate: It represents the number of products added to the cart per number of product-detail views.
- Buy-to-Detail Rate: It represents the number of products bought per number of the product detail views.
2. Summary:
The metrics it includes:
- Sales Performance
- Unique Purchases
- Product Revenue (revenue from individual product sales)
- Quantity (number of units sold)
- Average Quantity
- Average Price (average revenue per product)
- Product Refund Amount
- Shopping Behaviour
- Cart-to-Detail Rate: It represents the number of products added to the cart per number of product-detail views.
- Buy-to-Detail Rate: It represents the number of products bought per number of the product detail views.
What questions does this report help you answer?
- How is your product performing in terms of quantity, revenue, and price?
- How is your product performing in terms of how users are engaging with it?
Takeaway
One of the major takeaways from this blog is that Enhanced Ecommerce Reports in Google Analytics can offer you the mother of all the data/insights you need to scale your business. However, to be able to use the data in your favour, you need an expert like EasyInsights.
EasyInsights brings all the data from app analytics, ad costs to CRM data, and website conversions into one place so that your digital marketing team can easily understand what’s going wrong. So, to fasten your analysis with the same metrics on Google sheet, Book a demo and talk to our product expert.