
Jump ahead to:
Getting Started With Tableau
Step 1 – Before starting work with Tableau, make sure there’s a functional account on Tableau, and the Tableau Desktop App is installed on the system.
Step 2 – Now, it’s to be checked if the Postgres Driver is installed in your system –
- If you operate with Windows, go to C:\Program Files\Tableau. Check if there’s a Drivers folder and it has the postgresql .jar file. If not, go to Step 3, else go to step 5
- If you operate with Mac, go to ~/Library/Tableau/Drivers. Check if there’s a Drivers folder and it has the postgresql .jar file. If not, go to Step 3, else go to step 5
- If you operate with Linux, go to /opt/tableau/tableau_driver/jdbc . Check if there’s a tableau-driver folder and it has the postgresql .jar file. If not, go to Step 3, else go to step 5
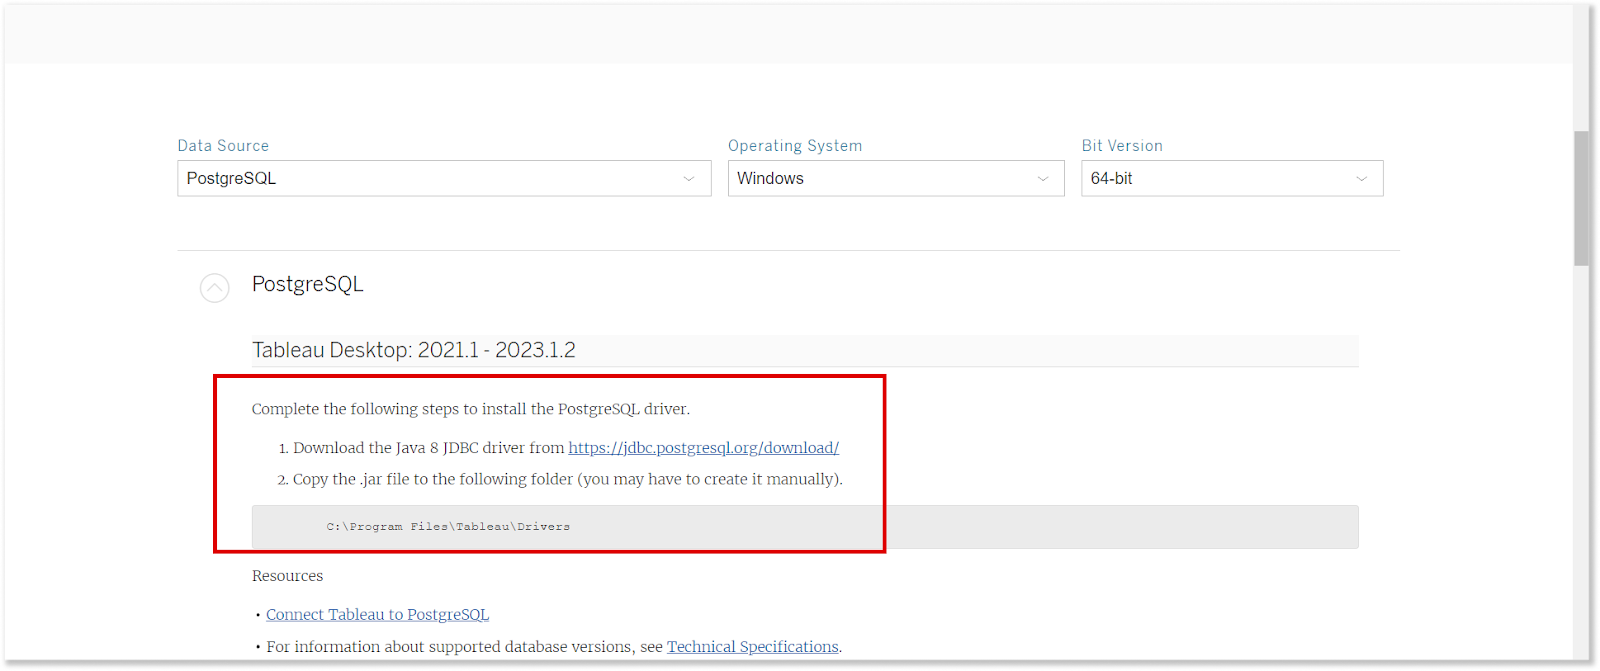
Step 3 – Go to the Driver Download. Here, select the Data Source as PostgreSQL and choose the Operating System and the Bit version
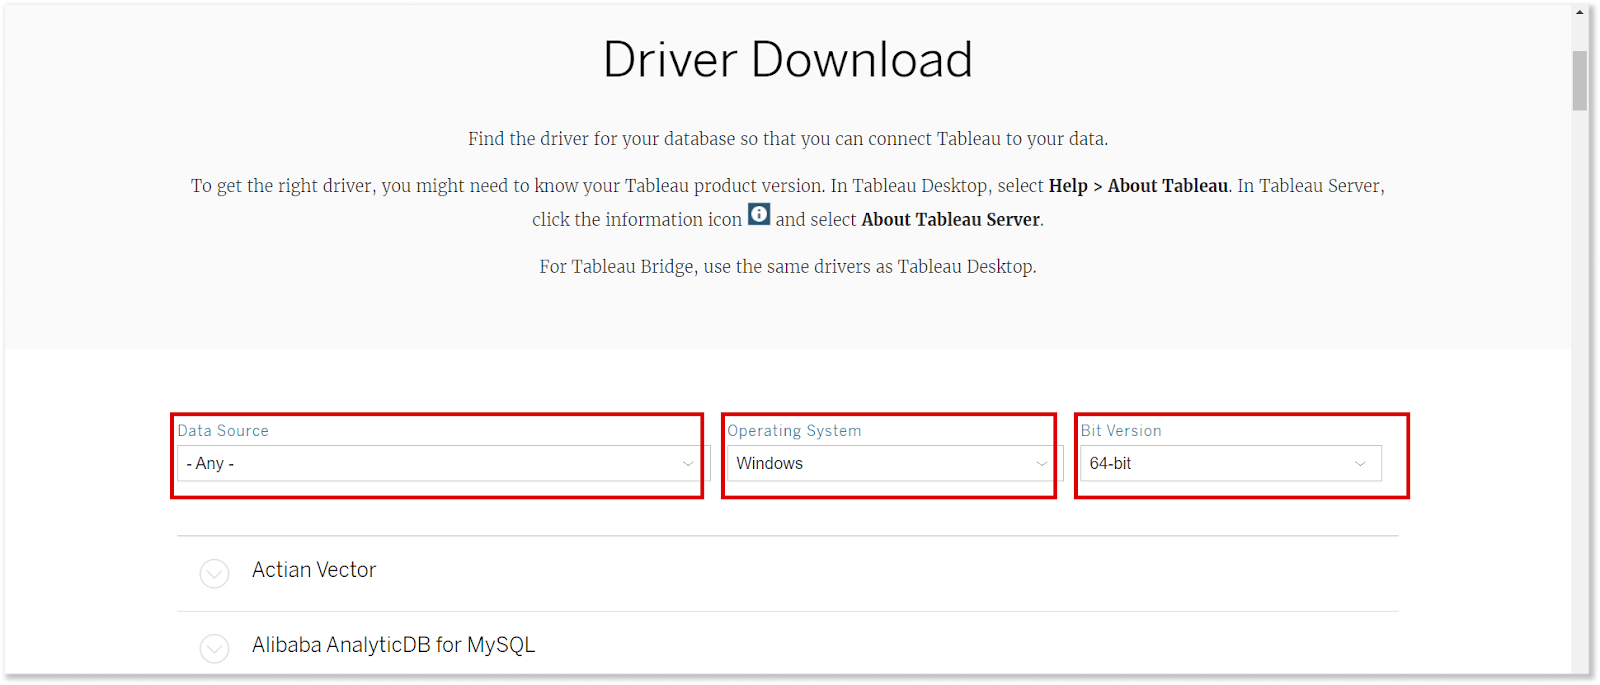
Step 4 – Follow the steps to download Postgres Driver.
Also Read: How to connect Google Data Studio with Postgres
Extracting, Transforming And Loading Marketing Data With EasyInsights
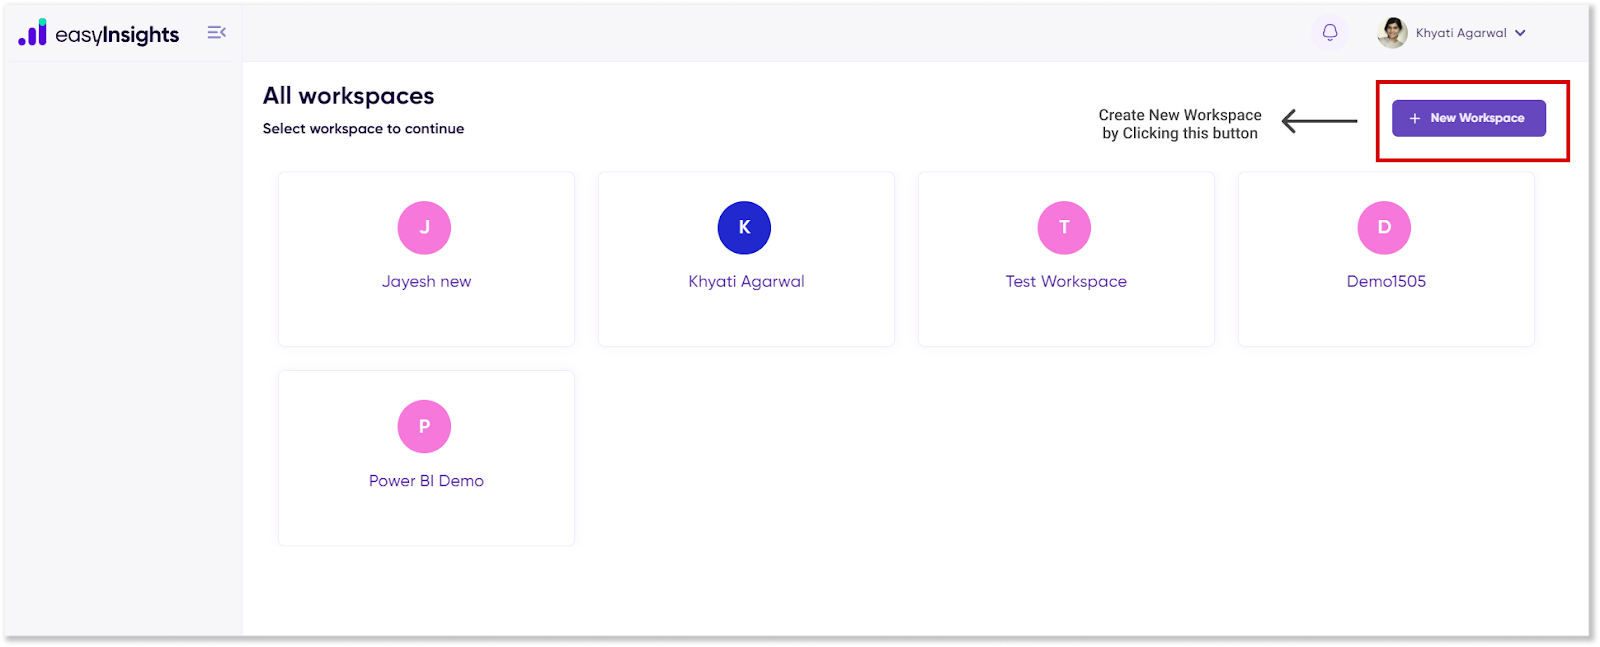
Step 5 – Log into the EasyInsights Account. The screen shown below will appear. Click on the Workspace of choice. A new workspace can also be created by clicking on the New Workspace Button
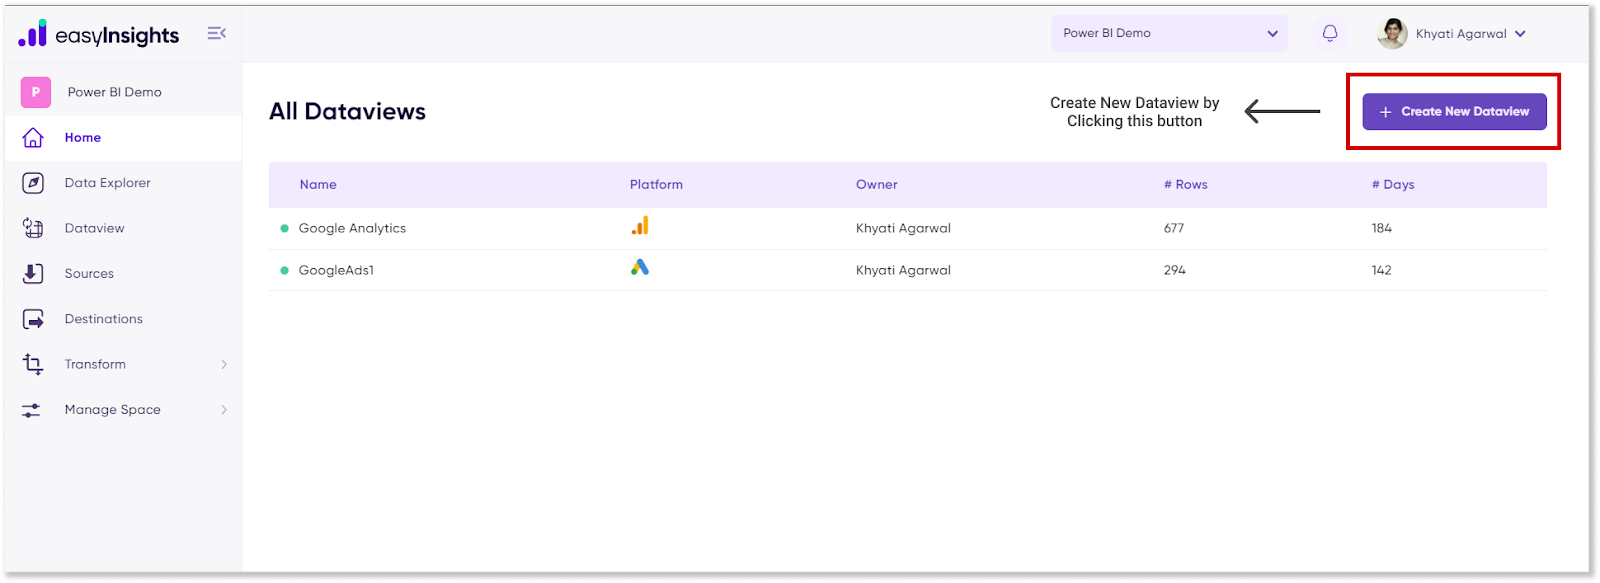
Step 6 – On clicking the workspace, the first screen that appears is the Home Screen. This lists the different dataviews created in that workspace. A dataview is a table that holds all the information which has to be transported from GA to Tableau. Whenever data is updated in the GA account associated with EasyInsights, the dataview synced with that account also automatically updates. These changes are reflected in Tableau’s Dashboard, all in real-time.
However, if the preferred Data Source (herein, its GA) is not connected/added to workspace, click on Sources in the side navigation bar. The following screen appears.
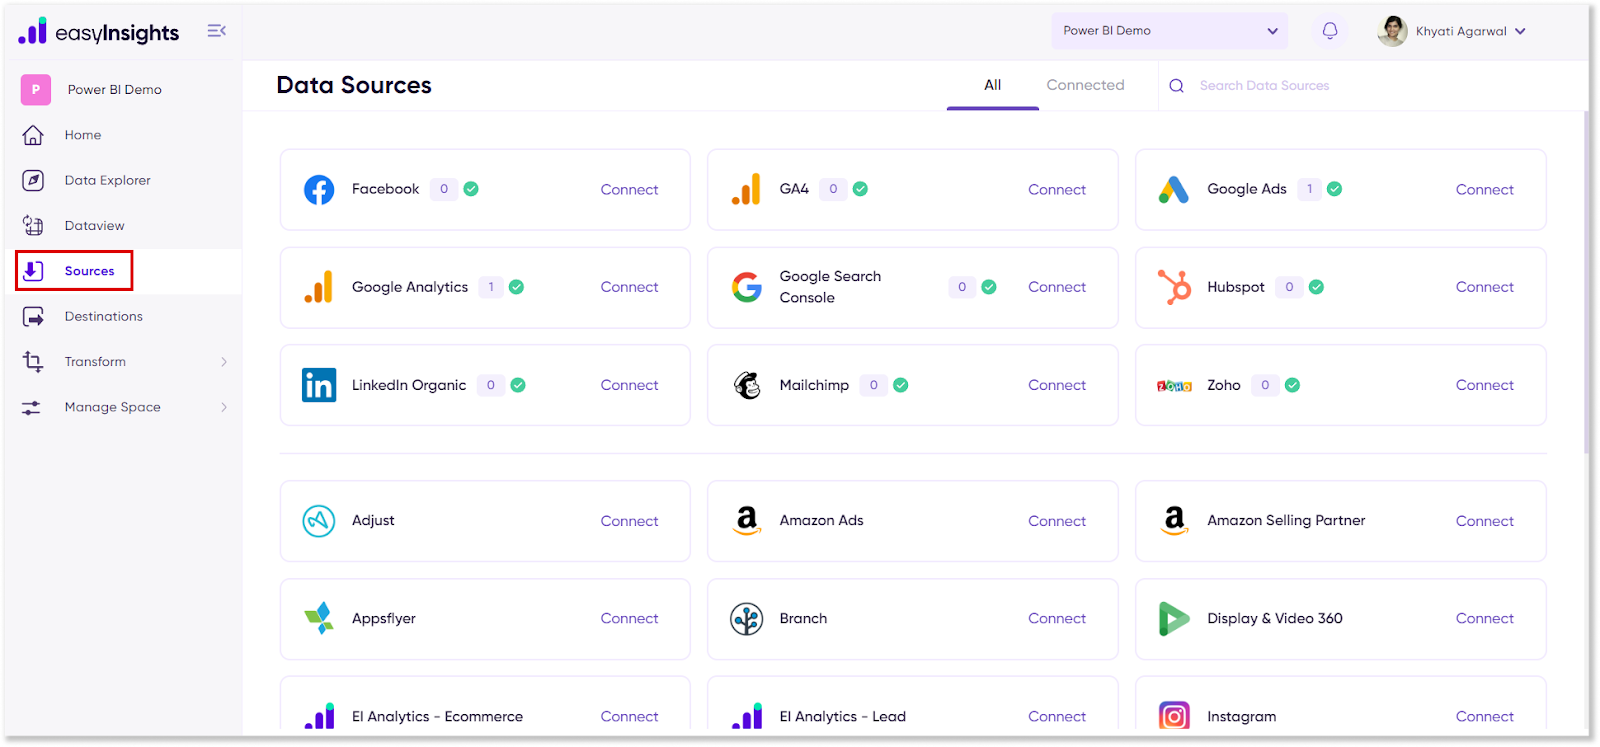
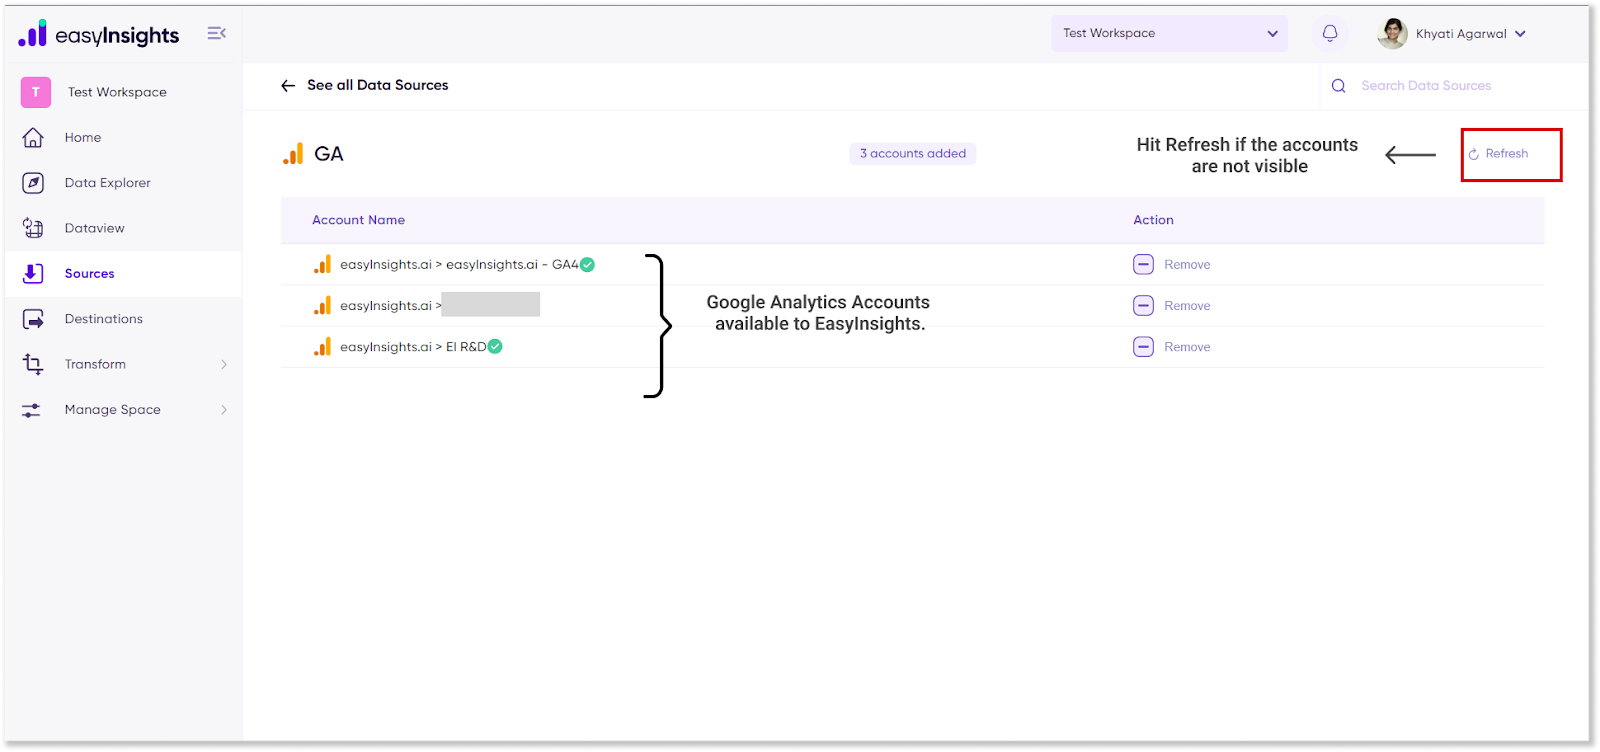
If EasyInsights already has access to the GA Account, then click on the GA card and the screen shown below will appear. Here, add the relevant GA Accounts to the workspace. (If accounts don’t appear, then hit Refresh). Now navigate to Home and click on the Create New Dataview button
However, if the relevant GA account is not connected to EasyInsights, then Click on Connect. It directs to a new window. Here, choose an account to continue to EasyInsights.
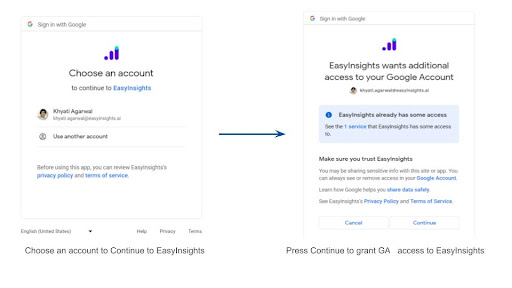
Then follow the above mentioned procedure to add the relevant GA Account to the workspace.
Step 7 – Now that GA is connected to EasyInsights, go to the side nav-bar, click on Home and then, Create New Dataview button. the following screen will appear. Enter the relevant details here – the preferred Data Source, relevant parameters for the report, name of the dataview and the time period of the data which is needed in the table.

Step 8 – Click on the Create button. If the dimensions and metrics are compatible, the Dataview will be created (if not, then an error message will be displayed and parameters have to be entered again). After the “Dataview created” message is displayed, we are redirected to the home screen where all the dataviews in that particular workspace are listed. Here, click on the dataview whose dashboard is to be created and the screen shown below will appear.
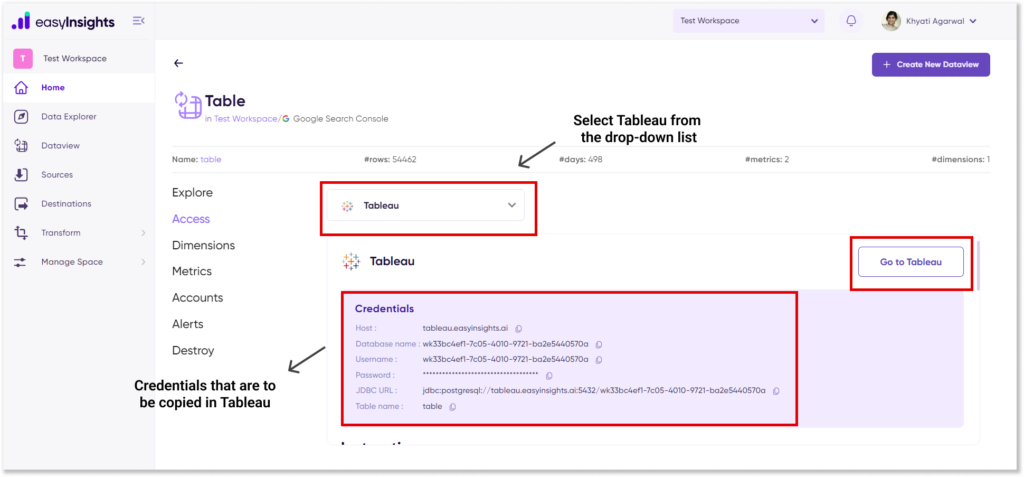
This screen is a place where a dataview can be fully explored. As a result, inferences can be drawn and insights generated within EasyInsights itself. Here, dataviews can also be deleted. But most importantly, the dataview can be loaded to a BI tool of our choice.
If the dashboard is to be made in Tableau, select Tableau in the drop-down list as illustrated above. Credentials will be generated. These credentials will be used by Tableau to establish access to the dataview from the Postgres warehouse where EasyInsights has loaded the data. Now click on the Go to Tableau Button
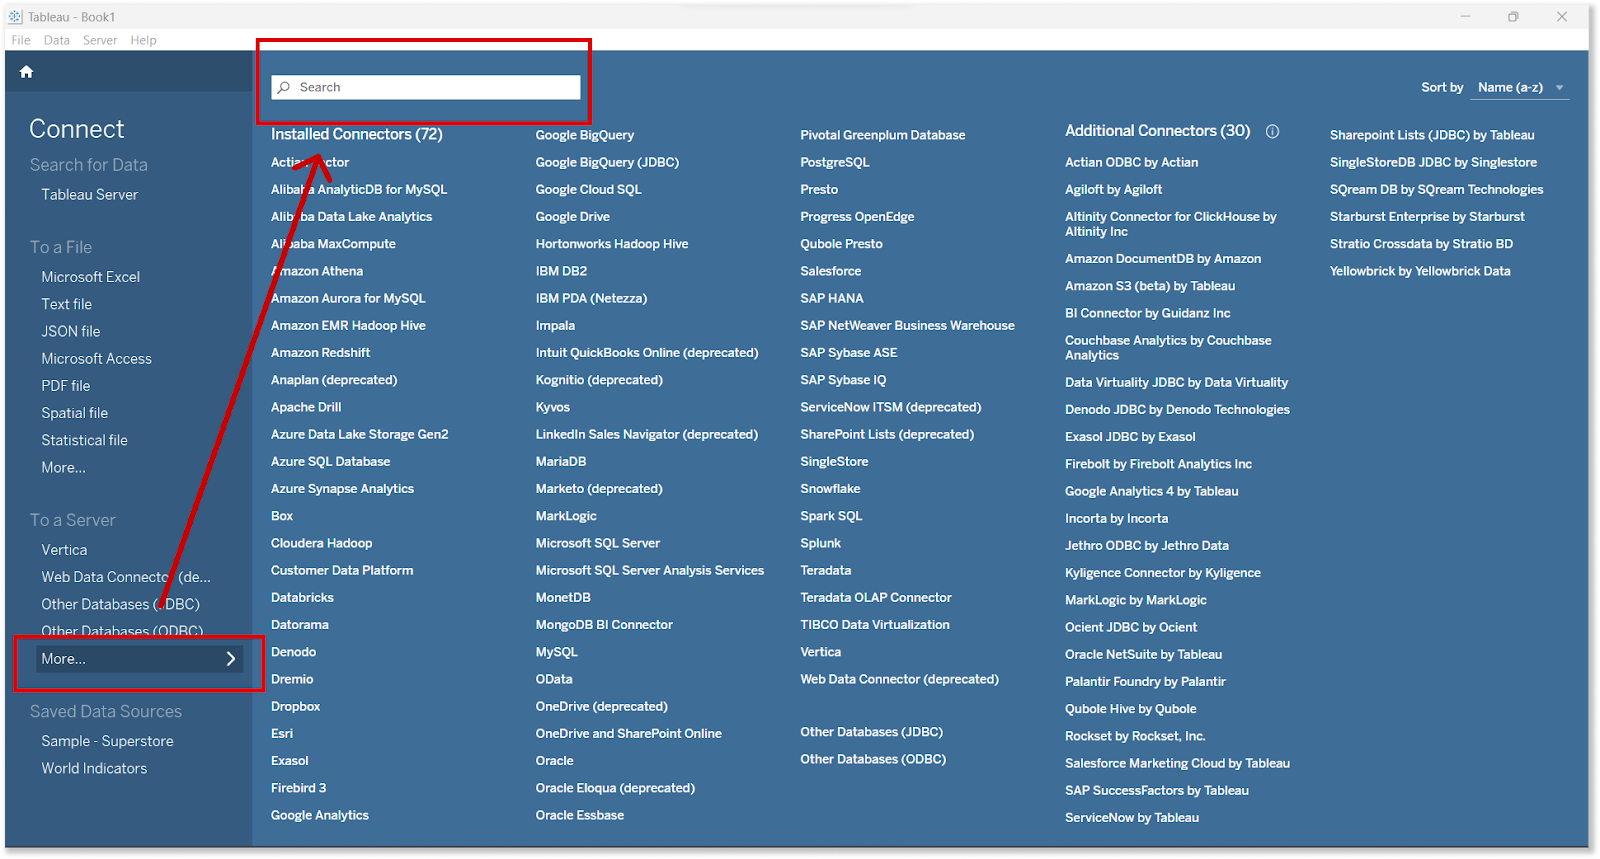
Step 9 – Sign in to the Tableau Desktop App. Here, click on To a Server > More. Now search for PostgreSQL, and click on it.
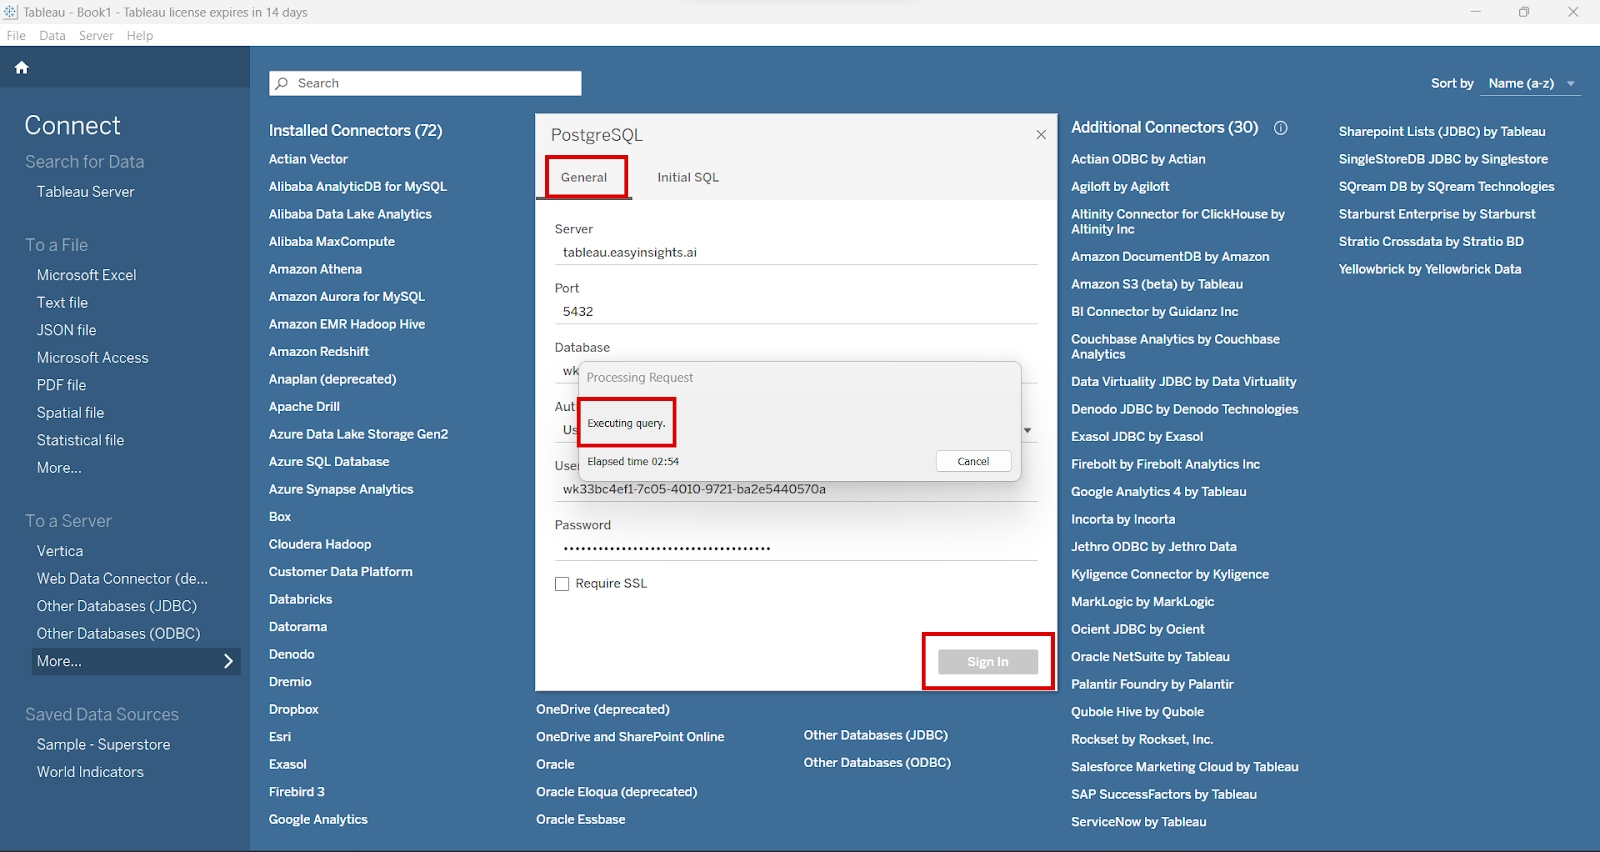
Step 10 – A pop-up will appear. In the General Section, fill in the credentials generated by EasyInsights generated in Step 8. Hit Sign In, and a pop-up comes up again. Tableau is now establishing access to the dataview.
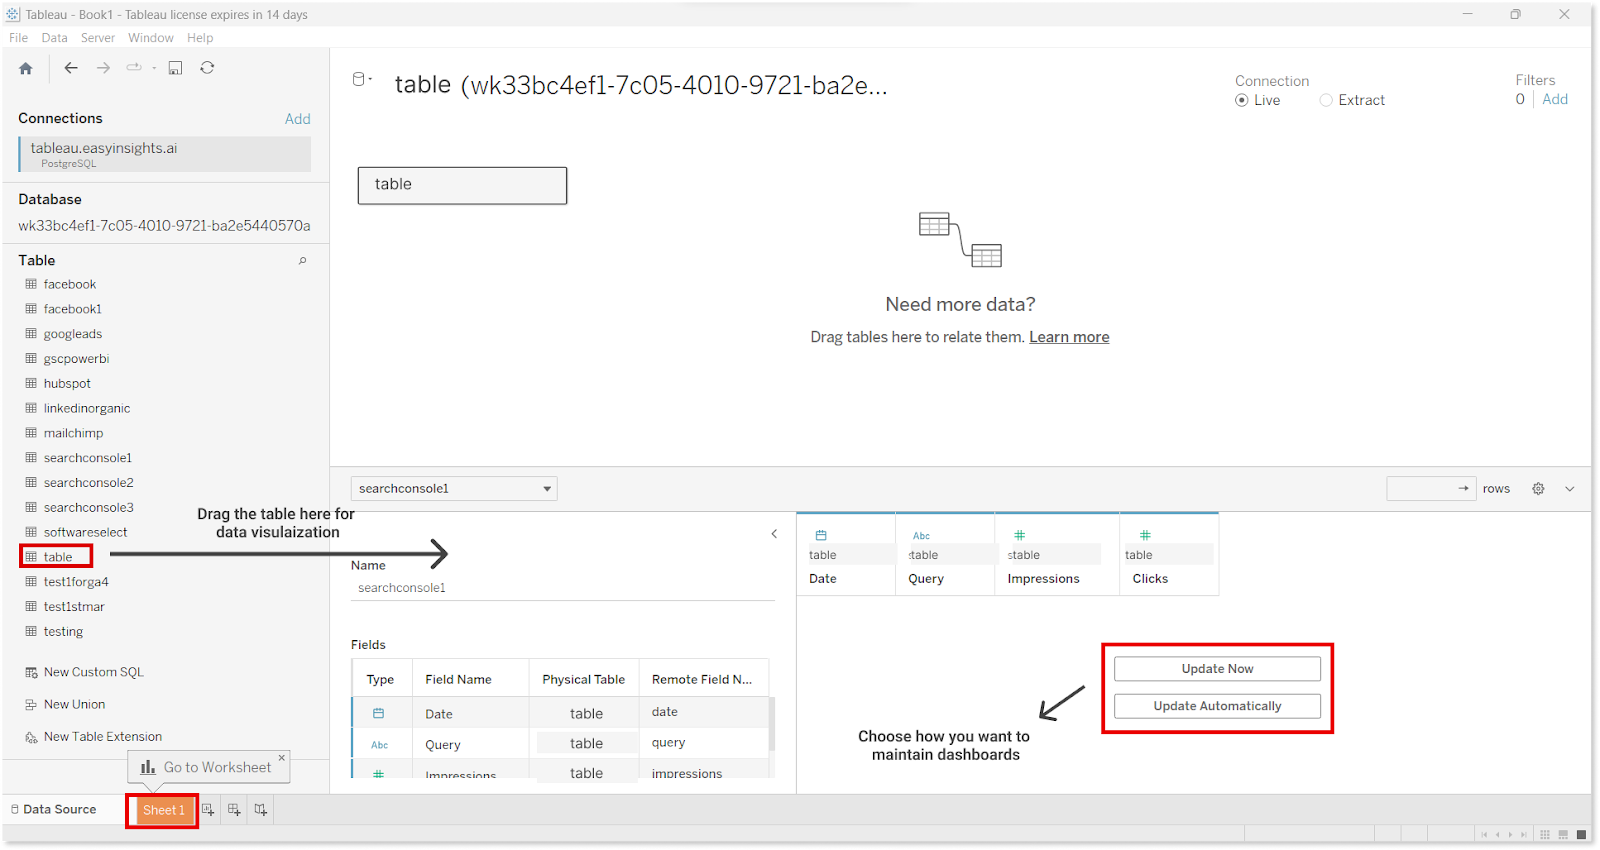
Step 11 – After the connection is established, the following screen appears. Here, click on the dataview whose dashboard you want to create. Follow the instruction, and drag the dataview to the main screen. The data will now get populated on the main screen. Here, choose how you want to maintain the GA Dashboard (Update now or Update Automatically). Now click on Sheet 1 at the bottom of the screen
Step 12 – The screen shown below will appear. Now GA Dashboards can be created and maintained on Tableau.

Recommended Reading –
1. Creating Google Analytics Dashboards on Looker Studio using EasyInsights – Link
2. Creating Google Analytics Dashboards on Microsoft Power BI using EasyInsights – Link
Create Marketing Dashboards on Tableau with EasyInsights
EasyInsights is a comprehensive marketing analytics tool that provides end-to-end data extraction and aggregation from various marketing platforms. It generates detailed reports that offer a granular perspective of your company’s overall brand affinity metrics. The tool can efficiently import and combine data from multiple platforms, including Google Ads, Google Analytics, Facebook Ads, CRM tools, and Search Console.
Liked the blog? Check out our other blogs to see how EasyInsights can help automate marketing reports and dashboards in minutes.
Want to achieve over 50% increase in your client retention rate? Click here to schedule a demo for EasyInsights.